Networked Urbanism
design thinking initiatives for a better urban life
apps awareness bahrain bike climate culture Death design digital donations economy education energy extreme Extreme climate funerals georeference GSD Harvard interaction Krystelle mapping market middle east mobility Network networkedurbanism nurra nurraempathy placemaking Public public space resources Responsivedesign social social market Space time time management ucjc visitor void waste water Ziyi

GSD Harvard – Fall 2012
Master Studio carried on during the Fall semester at the Urban Planning and Design Department at Harvard Graduate School of Design (GSD). Exploring the new role of the urban designer as an activator, mediator and curator of social processes in a networked reality where citizens are active producers or prosumers.
Think Big
As Boston continues on its mission to make the city into “a world-class bicycling city by creating safe and inviting conditions for all residents and visitors,” ridership and interest in cycling have all been on the rise. With new bike lanes, a new bike share program, and new cycling events coming to the city, we see a concerted effort to promote bicycling in Boston. However, with the rise cycling, we also see a rising trend in bike thefts as well. While ridership from 2007-2009 increased by 122%, bike thefts in Cambridge alone has gone up 54% from 2009-2010.
The issue of bike thefts is already a persistent problem in cities with robust biking culture such as London, where over 20,000 bikes were reported stolen in 2010 alone. Not only are the crimes detrimental to cycling culture in a direct way, but they also produce a type of psychological trauma. Studies have shown that 1 in 4 people who have had their bicycles stolen, never ride again.
Bike thefts as a phenomenon is complex and must be studied from all aspects, examining the different roles that factor into the narrative. From the bike owner’s perspective, we look at issues of bike security practices and theft deterrence and awareness. From the thief perspective, we must understand the risks they take and how they operate. Bike theft as crime is low priority for most police forces. Even when apprehended persecution is minimum, making bike theft a low risk/high reward crime. Finally, the aftermarket for stolen bikes should be examined. Prospective used-bike buyers create the market for stolen bikes. How are used/stolen bikes sold, and how can buyers be a part of the effort to reduce theft?
Start Small
The first stage of the project calls for data collection and research. I am in the process of building a website that will allow users to geotag where their bikes were stolen. We can begin to get a “heat-map” of high(er) theft areas, and begin to analyze their commonalities. Data will be user submitted. The website will both function as a research tool, and also as information for the general public and part of a possible recovery effort.
Act Now
Interviews with the Harvard Police Department will be conducted on understanding the criminal charges and the punishment for bike thieves, how the police combats this rising problem, current initiatives, as well as a request for crime statistics and possible police reports.
Understanding the negative impact that Google Maps has had on the realm of cartography, expressing the map as either a flat diagram or 3d satellite imaging, I am looking to understand how crowd sourcing can help to remap our understanding of the city. Many urbanites carry super computers in their pockets, full of sensors and transmitters these devices have the power to collect and disseminate information in real-time.
Focusing on the growing use of the bicycle as a main means of transportation I will begin remapping the city in an effort to describe the experience of riding in the urban environment. My hope is that this research will not only map the existing conditions, but also inform future urban developments.
I am currently researching what the City of Boston has already done, and is doing to improve the cycle infrastructure. I am interviewing people from Boston Bikes, Boston Cyclists Union and Livable Streets in order to gain a comprehensive understanding of the current conditions. I am also constructing a sensor that will be mounted on my bike that will link accelerometer data with GPS coordinates to map the micro-topography of the city, this is the first step in developing an app that will use smart-phones to collect this data and continuously remap the city in real-time.
01leonard, 02share, 03experience mapping, 04crowdsource
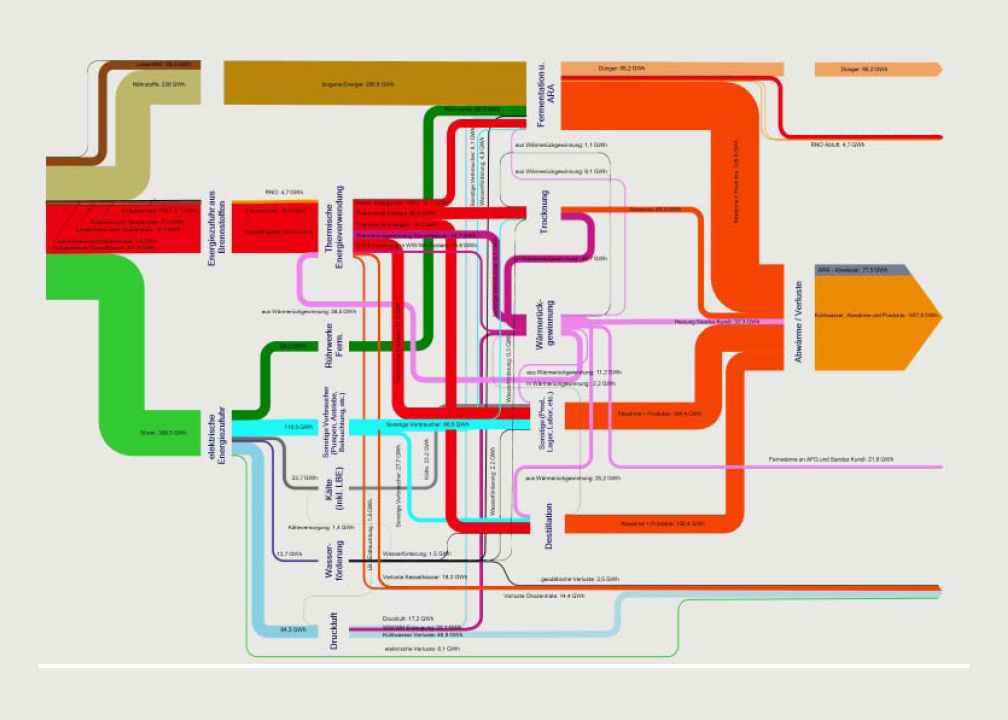
I’m proposing to link the idea of understanding energy infrastructures with public education. I think there is a way to encourage sustainable behavior insofar as it relates to energy conservation by engaging a network of young students in Boston. The first step is to visualize the vast amount of information that exists about our energy infrastructure, and then create a system whereby students can interact with that infrastructure via a web or mobile interface to a social network. Without going into too much detail, I think it’s possible to combine educational programs with incentives to conserve and/or responsibly use energy (in all its forms). I am really inspired by the Natural Fuse project by Usman Haque, and I’m wondering how that system might be scaled up.
Think Big:
How can we encourage people to understand, appreciate, and sustain our urban energy infrastructure. Is it possible to develop a system that teaches people to conserve energy, on a scale large enough to make a significant contribution to offsetting our collective carbon footprint?
Start Small:
The first step is simply to understand how energy is created, distributed, and consumed in the city of Boston. In order to approach the complexity of the energy infrastructure that exists in this city, I propose to develop an energy monitoring and visualization system for a select number of households, to get a sense of how a typical Bostonian uses energy in real-time. The next step is to connect this system to social networking sites (Facebook/Twitter) and open the platform up to students in the area. The ultimate goal is to incentivize energy conservation by engaging a large network of students who can keep each other accountable in terms of their energy use.
Act Now:
Currently refining the ideas of the proposal, and trying to think how this system might be different from energy conservation programs that have failed in the past. What would be the most effective way to visualize the information at hand, and how will I engage the community to garner interest in the project?
Think Big:
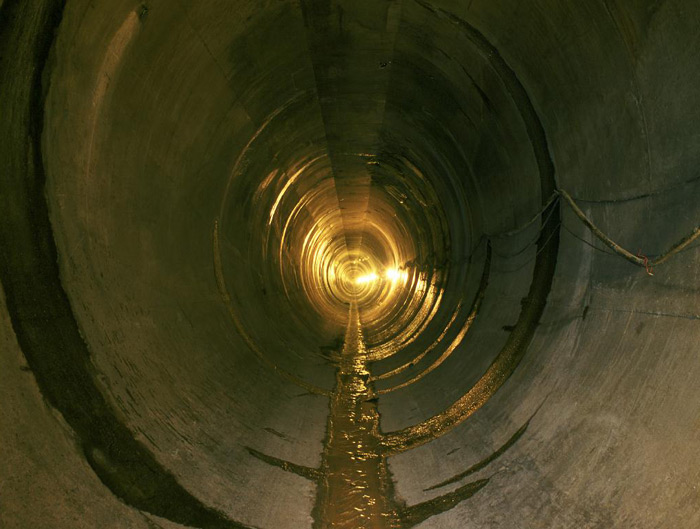
How can we better inform people about the unseen infrastructures and energy required to get potable water to their homes, and encourage them to conserve and treat their own water?
Start Small:
I plan to create a website with information on how far your water has traveled, how much energy was used to get it there, and the environmental impacts of moving water- giving people a virtual tour of an infrastructure they usually have no knowledge of. I also plan on designing a DIY water treatment/rain water collection (mini) landscape that can be used in urban areas… I’m thinking something you can put on a typical Boston porch.
Act Now:
Working on research of water infrastructure in the Boston area, potential areas for water re-use for Bostonians and speaking with key players in this area.
This is an awesome site where New Yorkers can help map out the texture and culture of the city with their own videos. The site calls on residents to upload personal video accounts of their experiences in NYC, which will be viewable by geography. Each video helps to build out the website, block by block. I would love to see this done in Boston. I’m going to try to get this done in Boston.
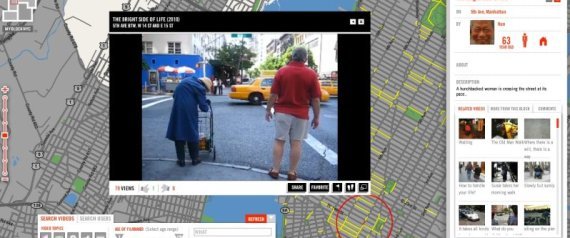
MIT automatic real-time mapping project is really blowing my mind right now.
Think Big (and some questions I have):
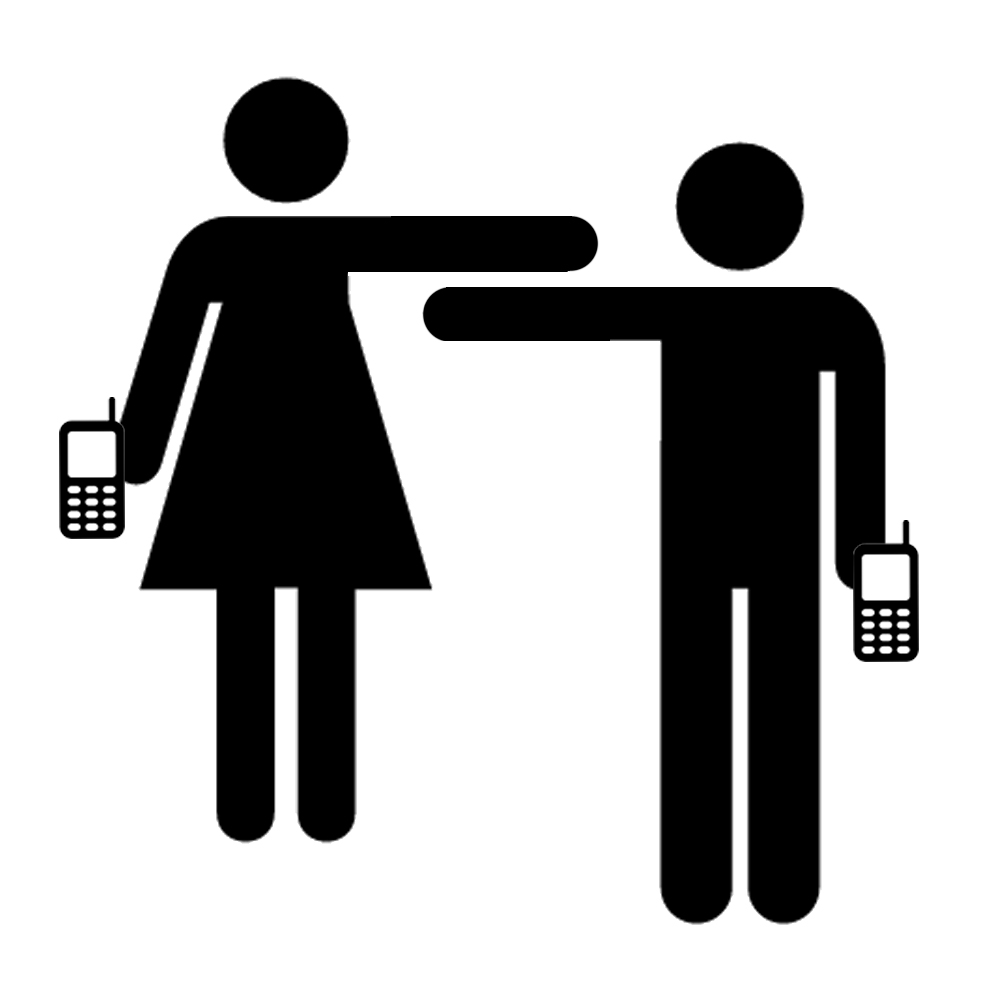
Is there a way to connect people in a community, location specific, to expand social networks in one’s public and/or private layers?
I am still really intrigued the idea that individuals have multiple identities which we turn on and off depending on our physical location. I may portray myself one way in a coffee shop versus another way at the GSD. Can these layers of interests, location specific, begin to create connections that would have otherwise been unnoticed?
How much are people willing to share? Are we more willing to share our public layers (ie. skills, job, etc.) to gain business contacts versus private layers (ie. hobbies) to gain friendships? Can this service serve both functions?
Start Small:
After visiting New Urban Mechanics, it seems that this office is acting as the ‘middle man’ to create the same connections I am interested in between people in Boston who can help each other accomplish ideas. I proposed working with the office in developing a digital system for submitting proposals so these connections can also occur through a digital layer rather than just contacting the office directly. (Waiting to hear back)
I would like to focus on both the digital submission process and submission of individual skills. How can this system connect people who can benefit each other?
Act Now:
I am in contact with New Urban Mechanics, MIT Media Lab students, and researchers at the Berkman Center for Internet and Society.
I have also met with a sociology professor at Harvard to discuss the basics of interaction, social identity theory, social networks, behavioral economics, and multi-plex networks.
I am also beginning to envision how a system of location based identity, or a physical social network, can exist. Perhaps coffee shops, community centers, workout facilities are tagged throughout the city which you scan into, turn on the layers you want to share in that location, and connect with others who have also called out that same layer in that location. Or perhaps the system allows you to look for a person with a specific skill set to grow a project. Then how can the connection be made between those two?
I suppose I large part of a successful mobile app intervention/invention is also to get a wide enough user base. Seems like this web platform does not have a mobile app endeavor yet and would like to see if I could partner with them, perhaps design the app together with them, to engage bartering in a more physical realm, catalyzing serendipitous matching of people with surplus and need.
https://ourgoods.org/projects
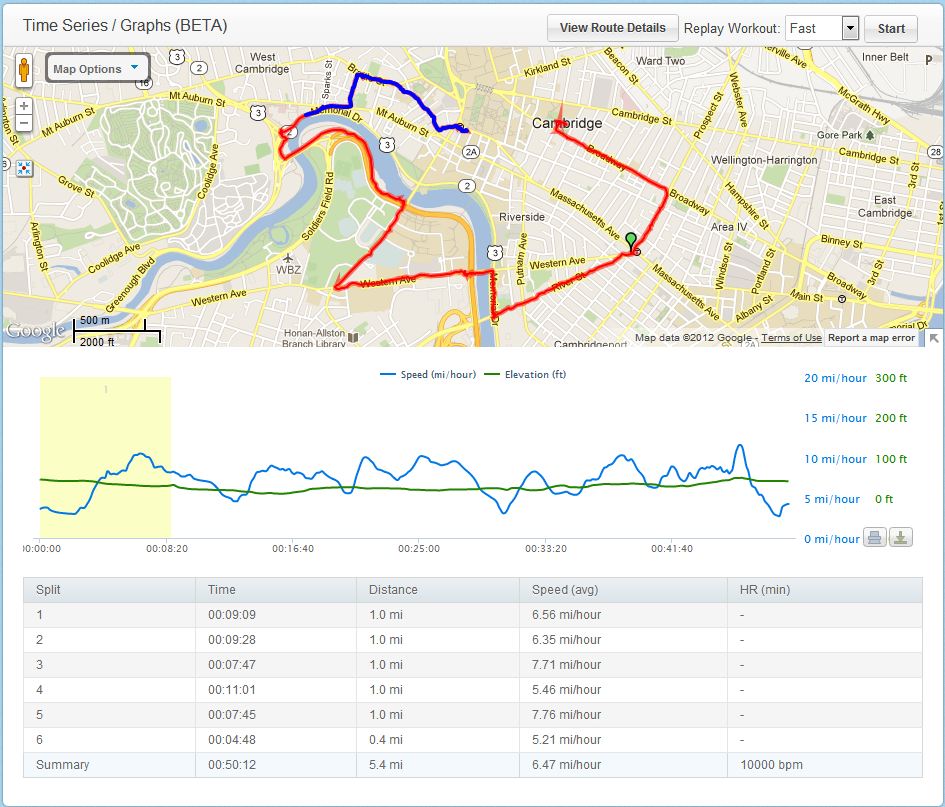
The following data was logged during the studio bike ride on Tuesday with the iphone app, MapMyRun. The data is more interesting than I originally thought since the pace was measured in realtime, and not as an average at the end. You can see the variable pace graphed along with the elevational data, which gives us a better understanding of the route. Rather than the trip takes us 50 min to complete, we know where we were the slowest, and can better identify the conditions that effect bike traffic (ie: road conditions, car traffic, multiple crosswalks etc.)
I speak French as well as James speaks Spanish, but I think you’ll get the point of this video.
« Previous 1 … 3 4 5 6 7 Next »