Networked Urbanism
design thinking initiatives for a better urban life
apps awareness bahrain bike climate culture Death design digital donations economy education energy extreme Extreme climate funerals georeference GSD Harvard interaction Krystelle mapping market middle east mobility Network networkedurbanism nurra nurraempathy placemaking Public public space resources Responsivedesign social social market Space time time management ucjc visitor void waste water Ziyi
Posts by Julia Mollner
The evolved sensor grid provides a comprehensive look of Portland’s air toxics throughout a day. The animation shows the flux of diesel related air toxics around the highly utilized, freeway areas. This shows the ‘interface’ that connects the physical city sensor grid to the individual device. Citizens will be able to connect directly to the ‘interface’ and gain information about their surrounding air contents. (click on image to see full screen animation)
This is a mock-up of how our gird system will dynamically represent the real time data that will be collected through our grid sensors. As individual commitment to awareness, the personal device will add to the real time data and create a new layer of information to inform design opportunities and constraints.
After our initial research with the animated topography, we have determined that our mapping database will be enhanced with visual representation through a gradient (see below). The top gradient topography is the most accurate representation of our data.


Our project is at the stage of creating the network and beginning to test run our initiative in a case study. We created layers of awareness from which we will market our product. The three layers are the initial grid, website, and individual device (see above, bottom-right). Now, we are in the mist of creating the online database (see below) and gathering equipment, specifically the particulate sensor, to put our plan into action and see if our mock-up works with a trial run.
(more…)
Let’s face it: every person needs air to breath. Good air quality is important for human health and with the rising population growth in urban areas, it is vital to maintain a healthy air quality for urban residents. Yet, how many people know about the current air quality in there region?
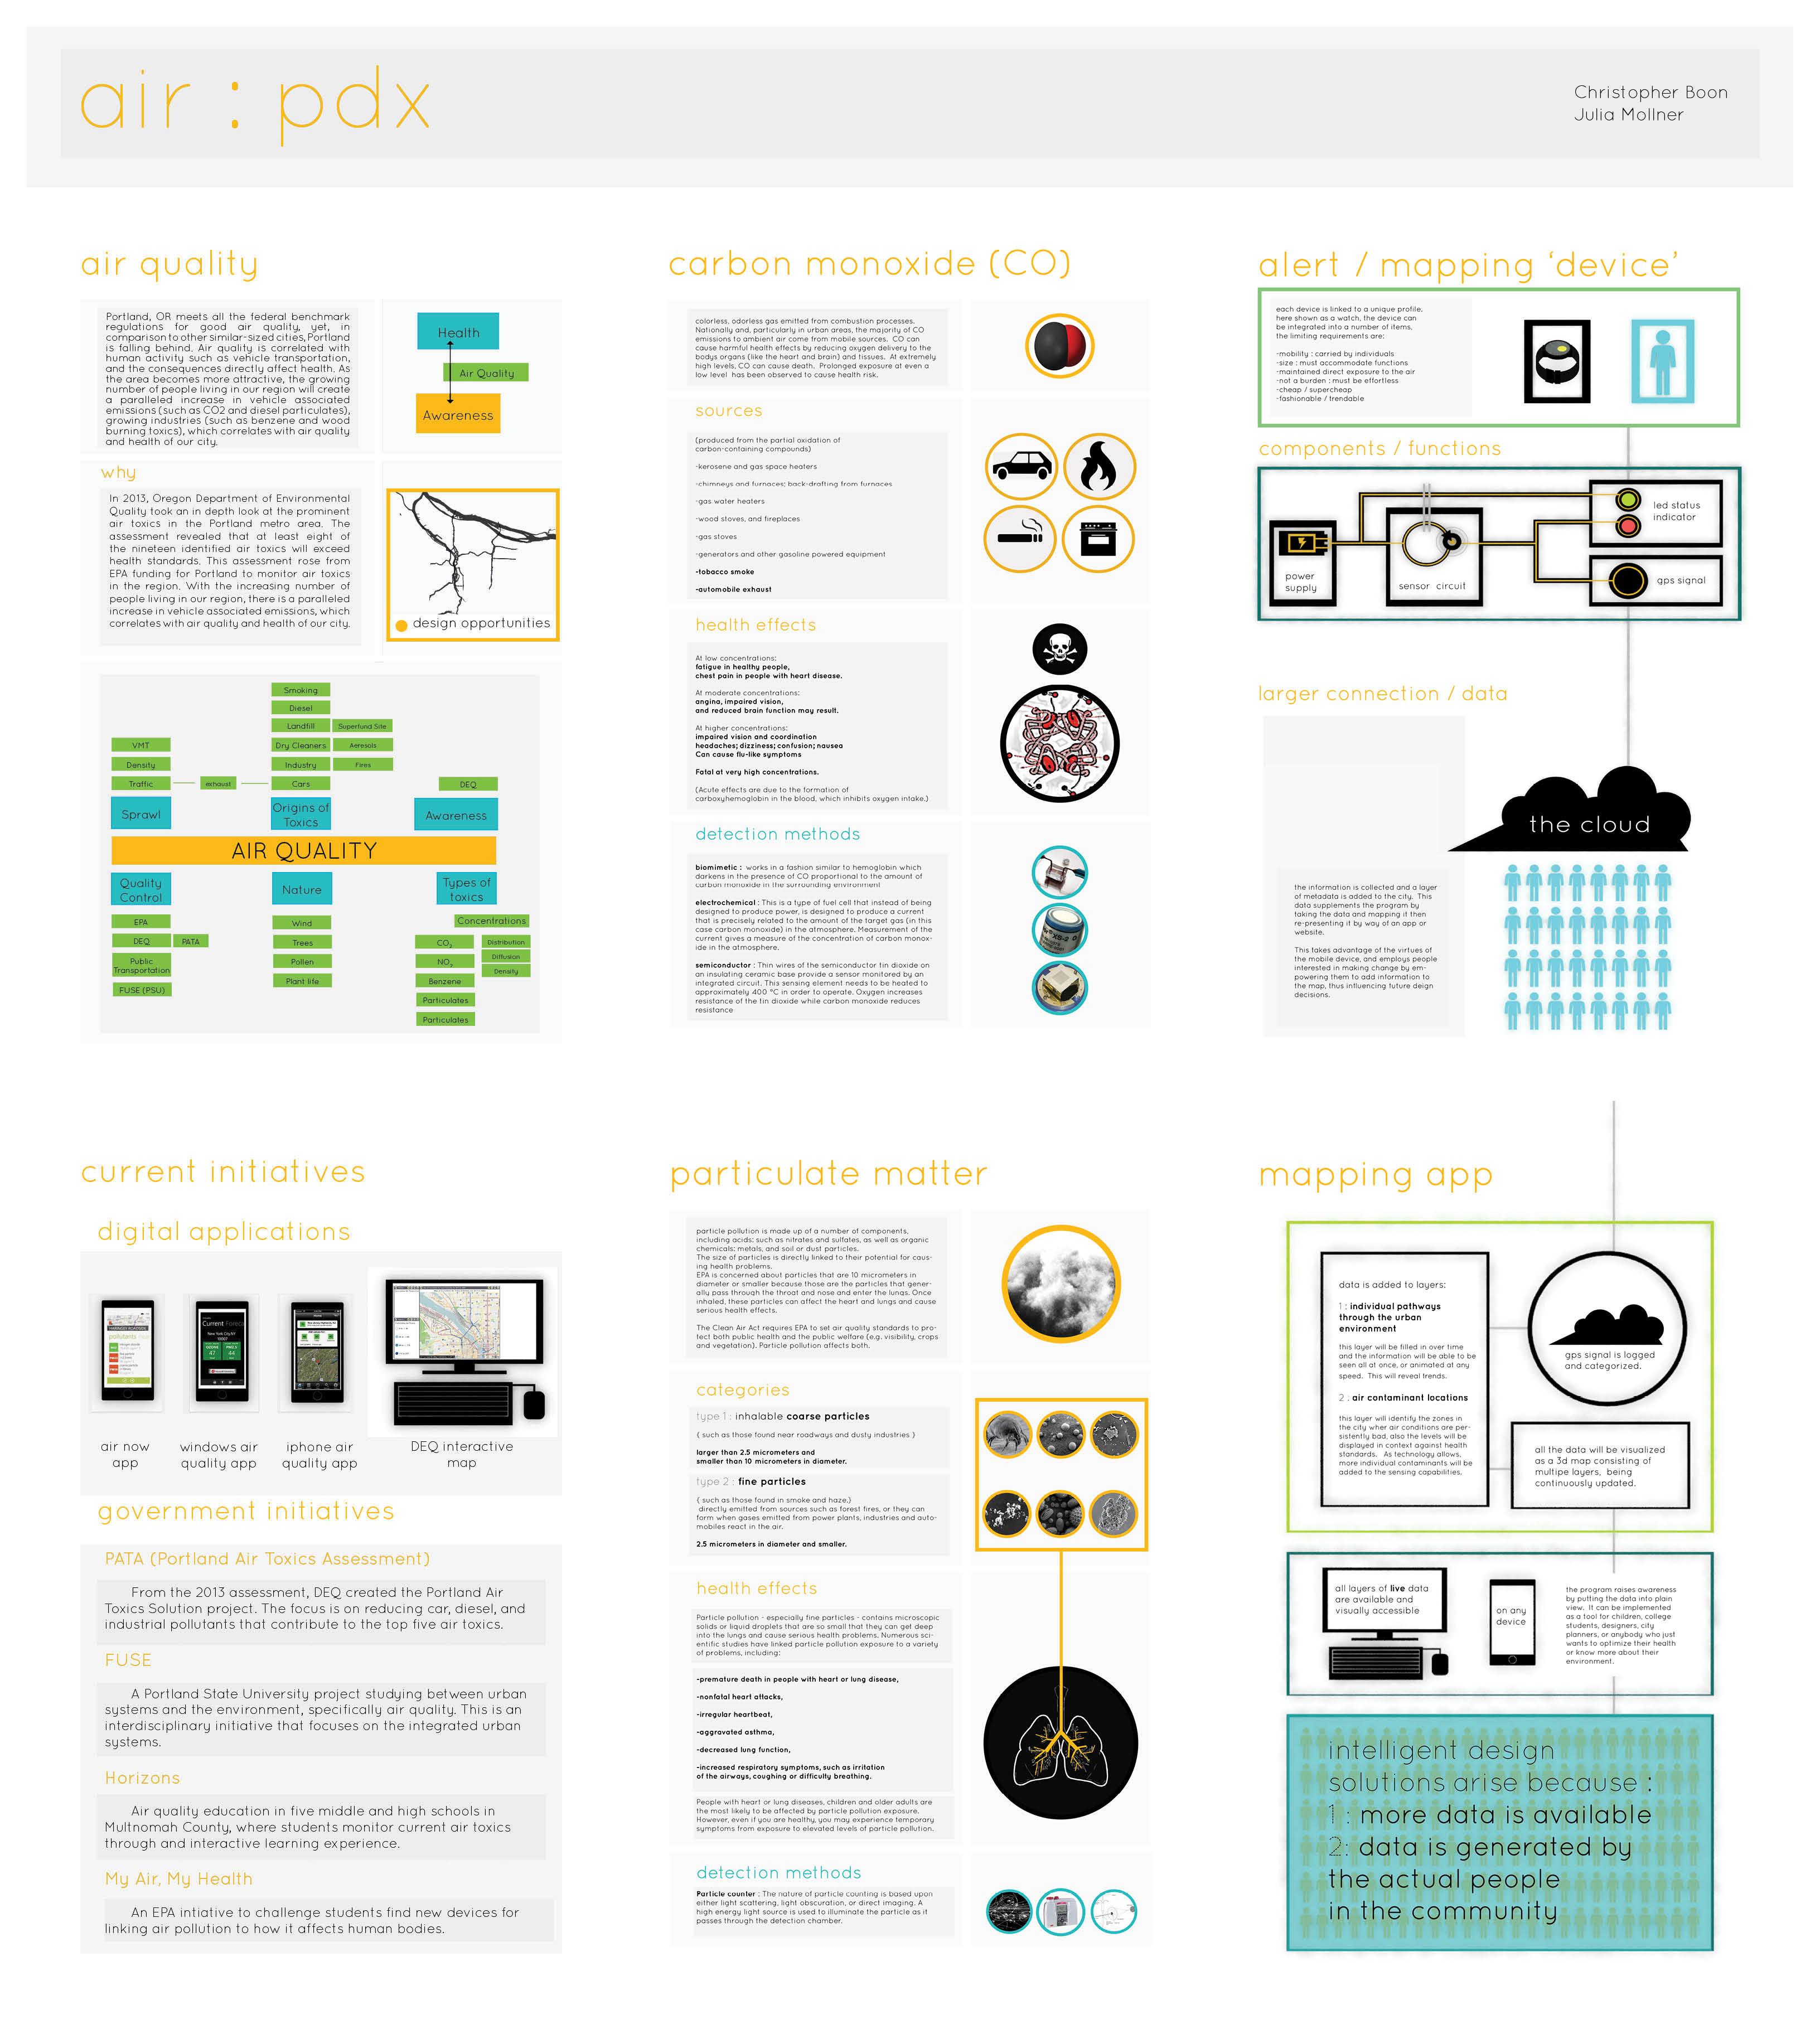
Portland, OR meets all the federal benchmark regulations for good air quality, yet, in comparison to other similar-sized cities, Portland is falling behind. Air quality is correlated with human activity such as vehicle transportation, and the consequences directly affect health. As the area becomes more attractive, the growing number of people living in our region will create a paralleled increase in vehicle associated emissions (such as CO2 and diesel particulates), growing industries (such as benzene and wood burning toxics), which correlates with air quality and health of our city.
In 2013, the Department of Environmental Quality (DEQ) projected the air quality for the metro area in 2017. This modeling was funded by the Environmental Protection Agency (EPA) and conducted by DEQ, revealed that at least eight of the nineteen identified air toxics will exceed health standards. This assessment rose from EPA funding for Portland to monitor air toxics in the region. DEQ identified the highest priority air pollutants. Air toxics such as NO2, CO, SO2, and diesel particulates were ranked the most important to reduce in the immediate future.
Our objective is to raise individual and group awareness of immediate air quality and the toxics in the air that affect daily and chronic health concerns. We aim to create a digital mapping interface that will analyze data from individual devices that are used by urban residents. This device, which is in development as to how it can monitor specific air toxics as a model for further toxic monitoring, will have features such as: a toxin sensor, a LED light which will illuminate when surrounded by unhealthy air levels, and a GPS tracker. The device will monitor one toxic to act as a surrogate which can be built upon in the future of monitoring other toxins. This is intended to give instantaneous notifications to the user of current air quality to immediate environment, as well as provide data to the mapping website. The website can be accessed by all and act as a comprehensive 3D model of air quality in correlation with human movement (understood through walking, biking, or driving).
The mapping interface can then provide insight into design intervention opportunities in locations where air toxins are the unhealthiest. By linking daily human movement with monitoring one air toxic, that contribute to a larger database of information, we can make more informed design decisions for new development and investment: we can create a healthier, more intelligent city.
From our pin up, the main concern was with the realization of a monitoring sensor that will be able to function in real life. Thus, the first step is to understand the technical aspects of monitoring sensors. To do this we are working with DEQ to understand the logistics of sensors and their accuracy. At the same time we will start creating the online map layers which will collect and represent the data in a user friendly manner and language.
Julia Mollner
Julia Mollner is a candidate for a Master of Architecture at Portland State University. She has a background in architecture, art history, and residence life. She is interested in the interdisciplinary design process, urban design, and the relationship between the scales of the built environment, community development and human activity.
It appears that Julia Mollner hasn't tweeted anything yet.