Networked Urbanism
design thinking initiatives for a better urban life
apps awareness bahrain bike climate culture Death design digital donations economy education energy extreme Extreme climate funerals georeference GSD Harvard interaction Krystelle mapping market middle east mobility Network networkedurbanism nurra nurraempathy placemaking Public public space resources Responsivedesign social social market Space time time management ucjc visitor void waste water Ziyi
bike
All you need to know about bikes in the city.
PROJECT STATEMENT
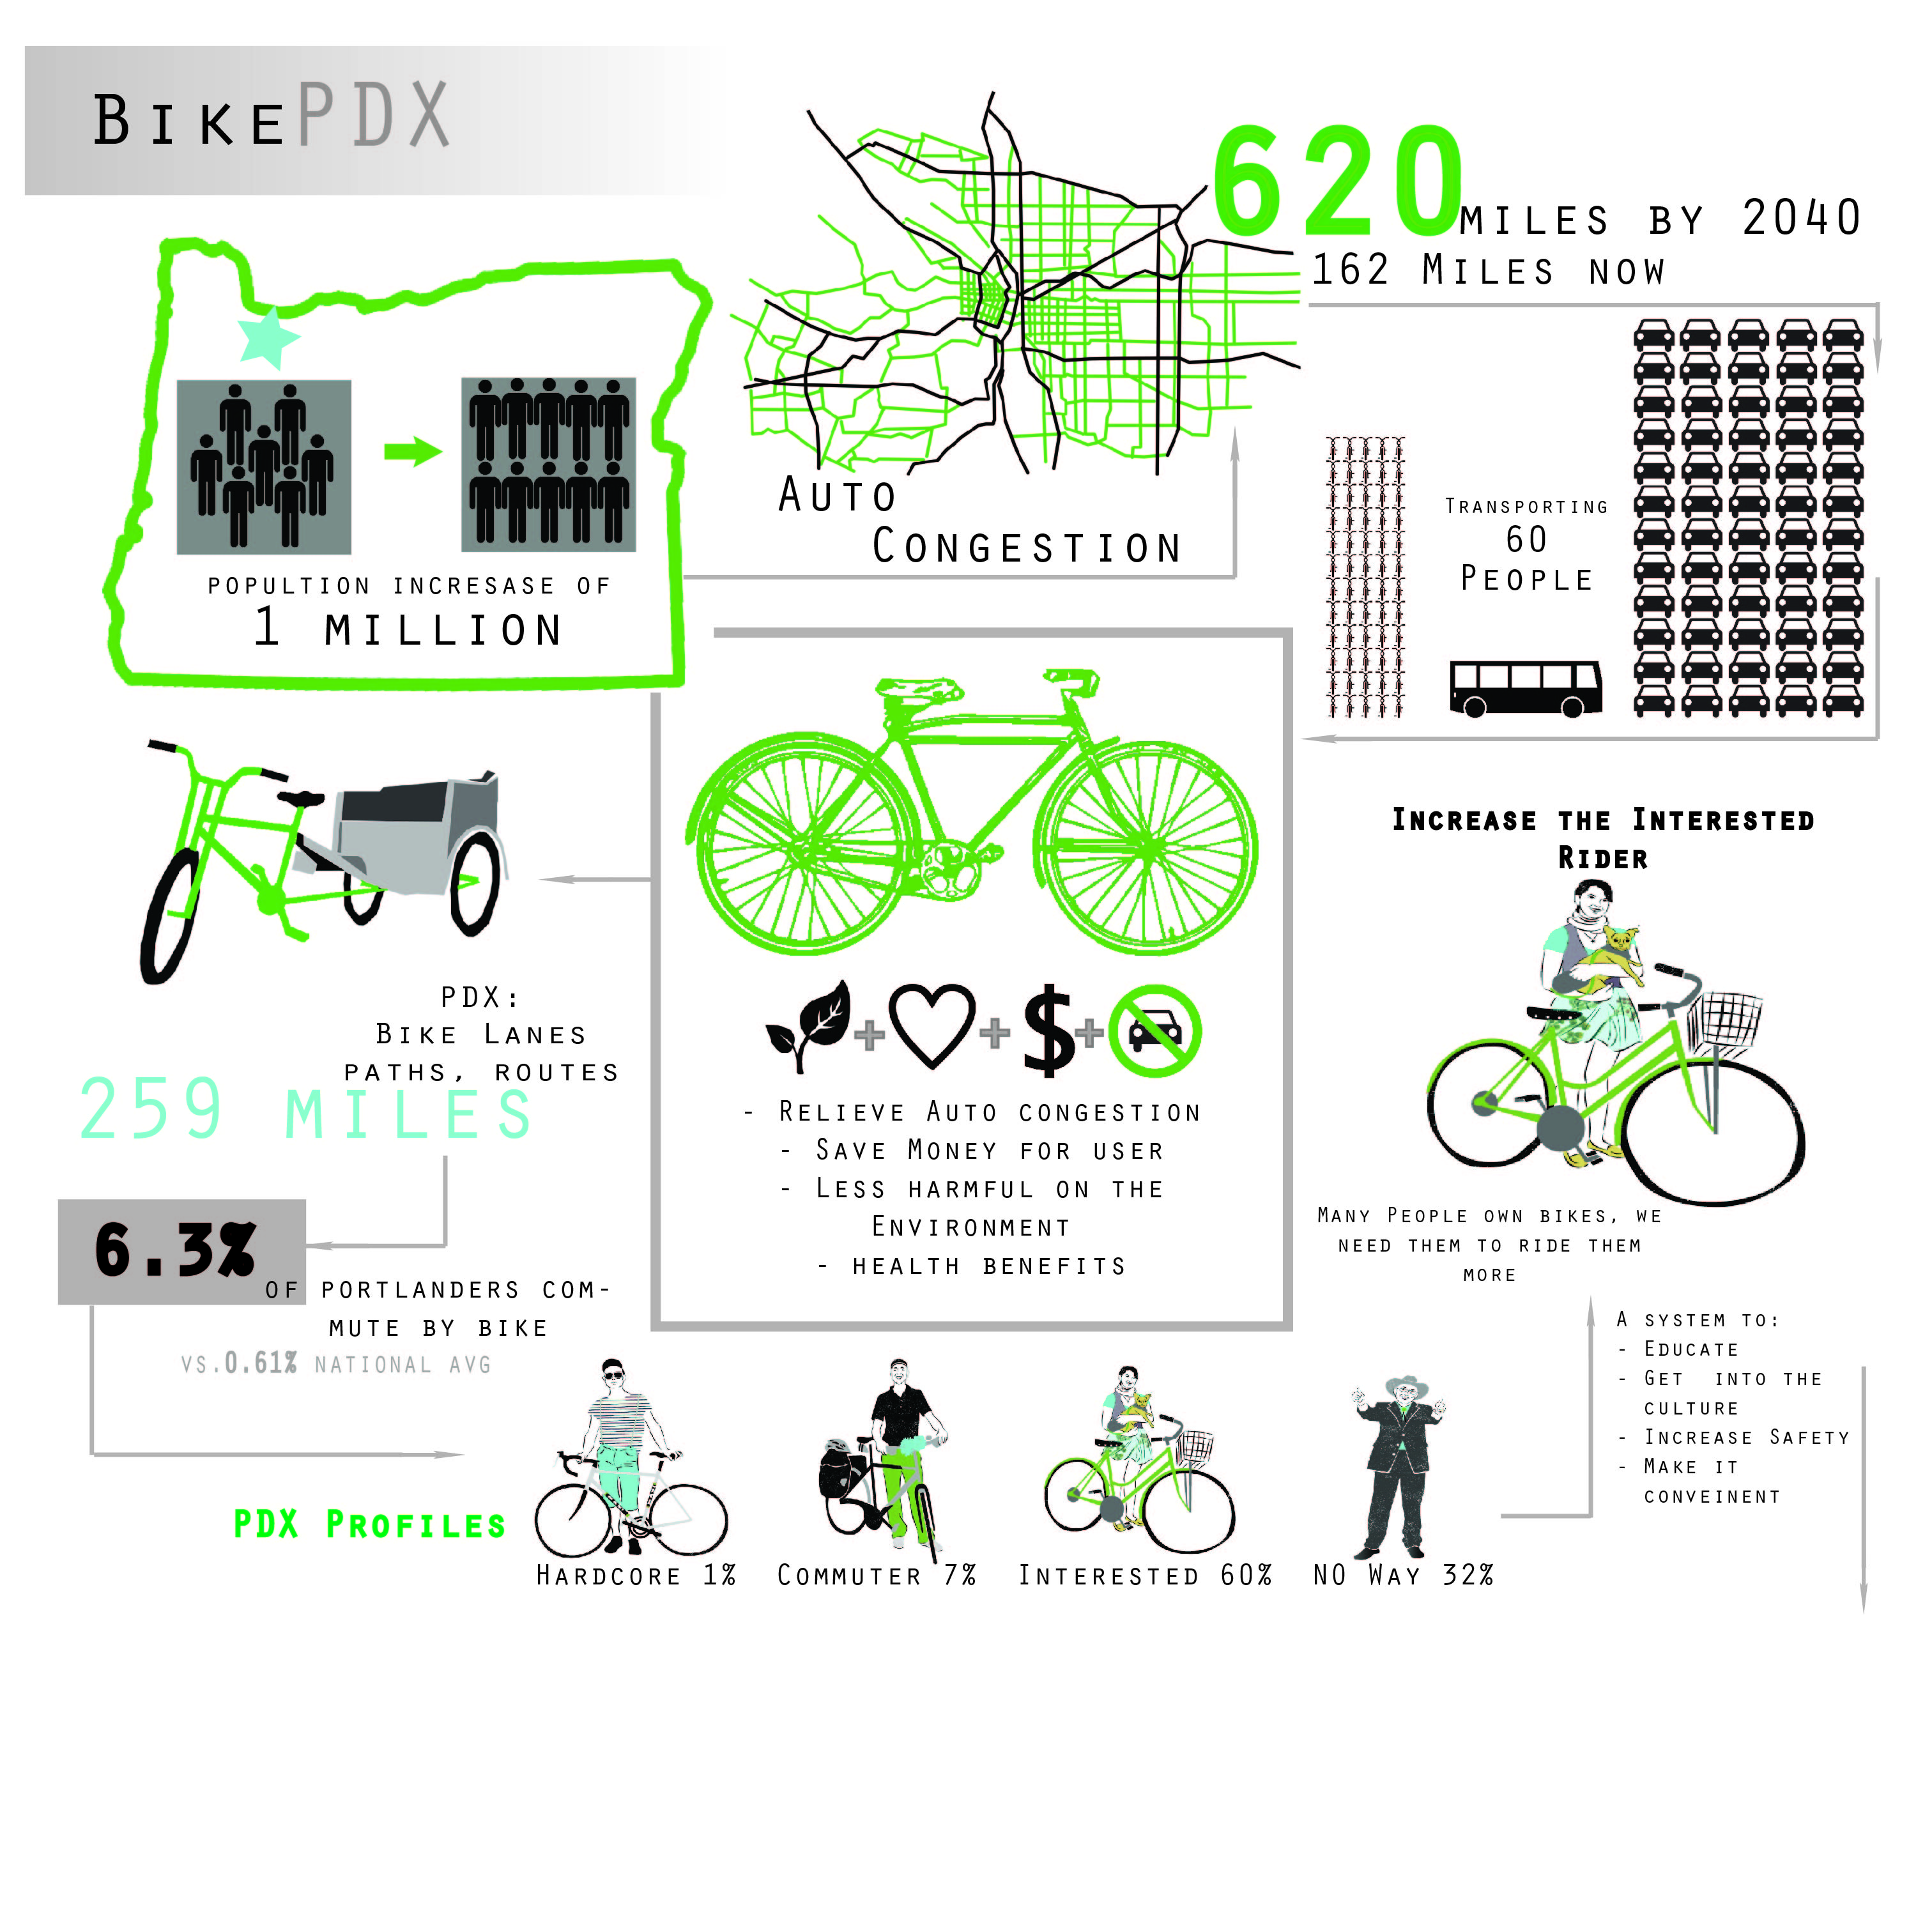
The problem is the future strain on Portland’s transportation infrastructure, due to the expected population growth of 1 million people by the year 2040.
Portland is expecting to become denser, and though Portland’s population has increased, the congestion of traffic has not. This is due to Portland’s predominant bike culture. Portland is America’s biking capital, with a bicycle commuter rate of 6.3% vs. the national average of 0.61%. There is already an existing system of bicycle pathways through the city of Portland, so building new infrastructure is not the way to generate more cyclists.
Our intent is to help Portland reach the modal split goal of 25% bicycle trips taken by the population inside the metro area. (more…)
We have created page accounts to go along with our app. This allows for deeper connection and to get the ball rolling on creating this app as a marketable item. Also along with the use of Facebook and Twitter as base pages, we have created a hashtag that goes along with our app and pages to further group conversations and connections.
https://www.facebook.com/bikingportland
https://twitter.com/BikingPDX
#bportland

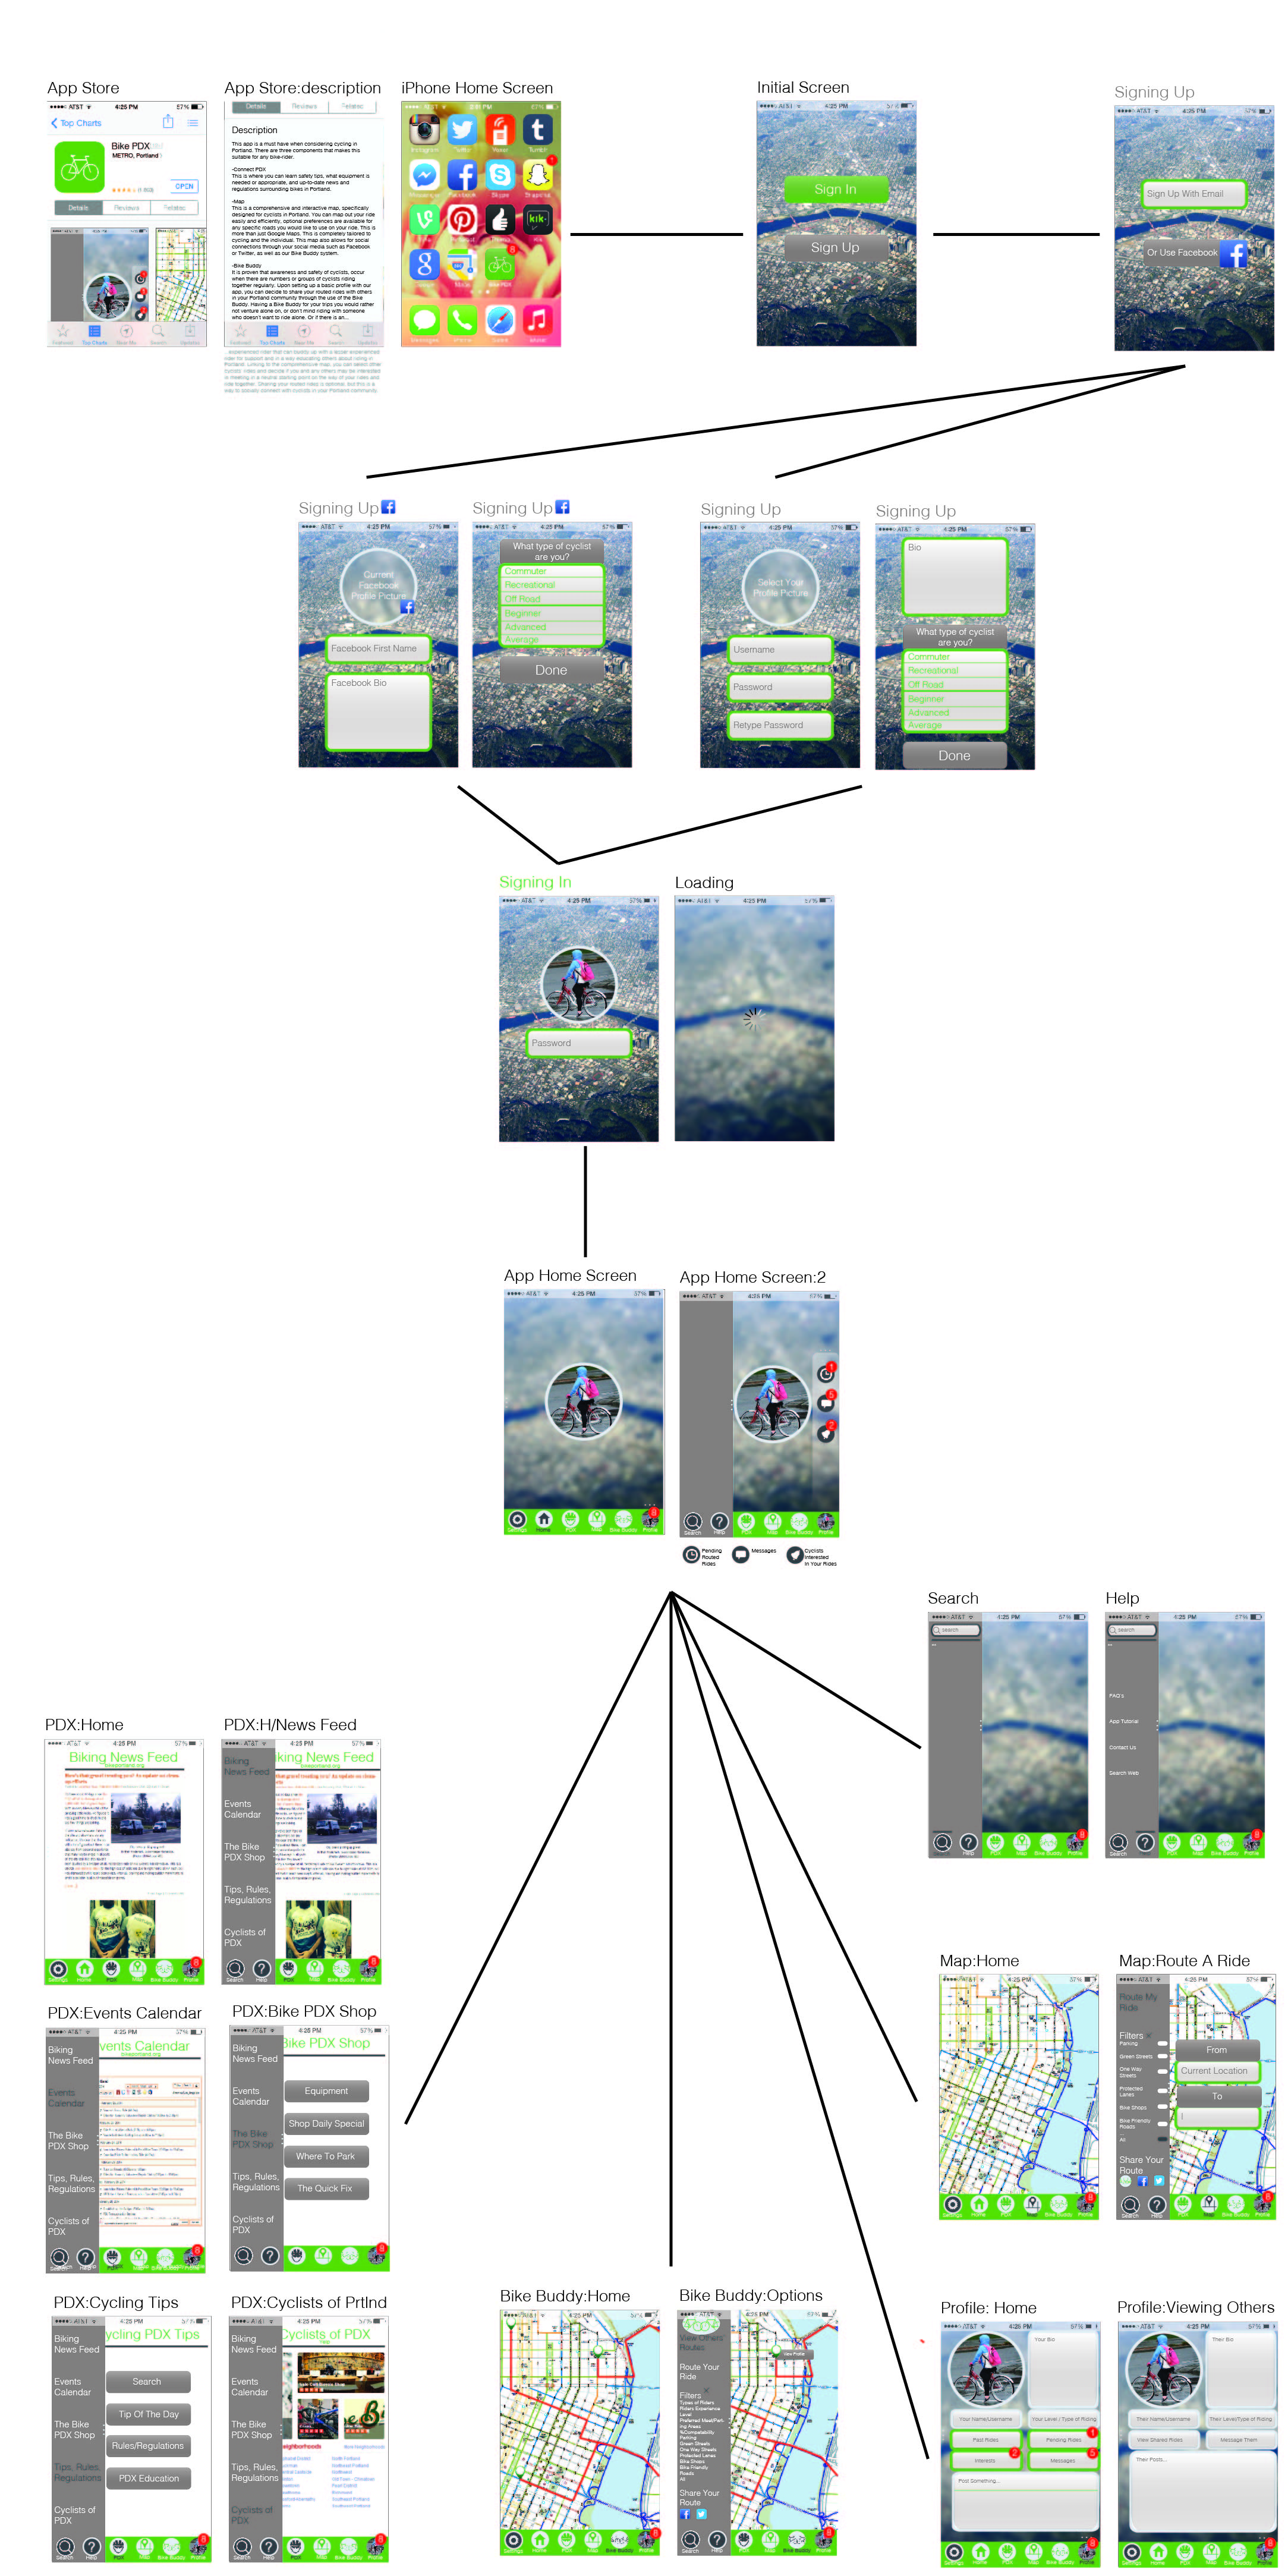
Here is a mapped out version of the development of the Bike PDX app so far…
We constructed a survey to better understand the people of Portland.

Here is the mock-up of the base structure/design of the interface of the App.

DenCITY_update of 2-3-2014_Cutright_Vanderhoof
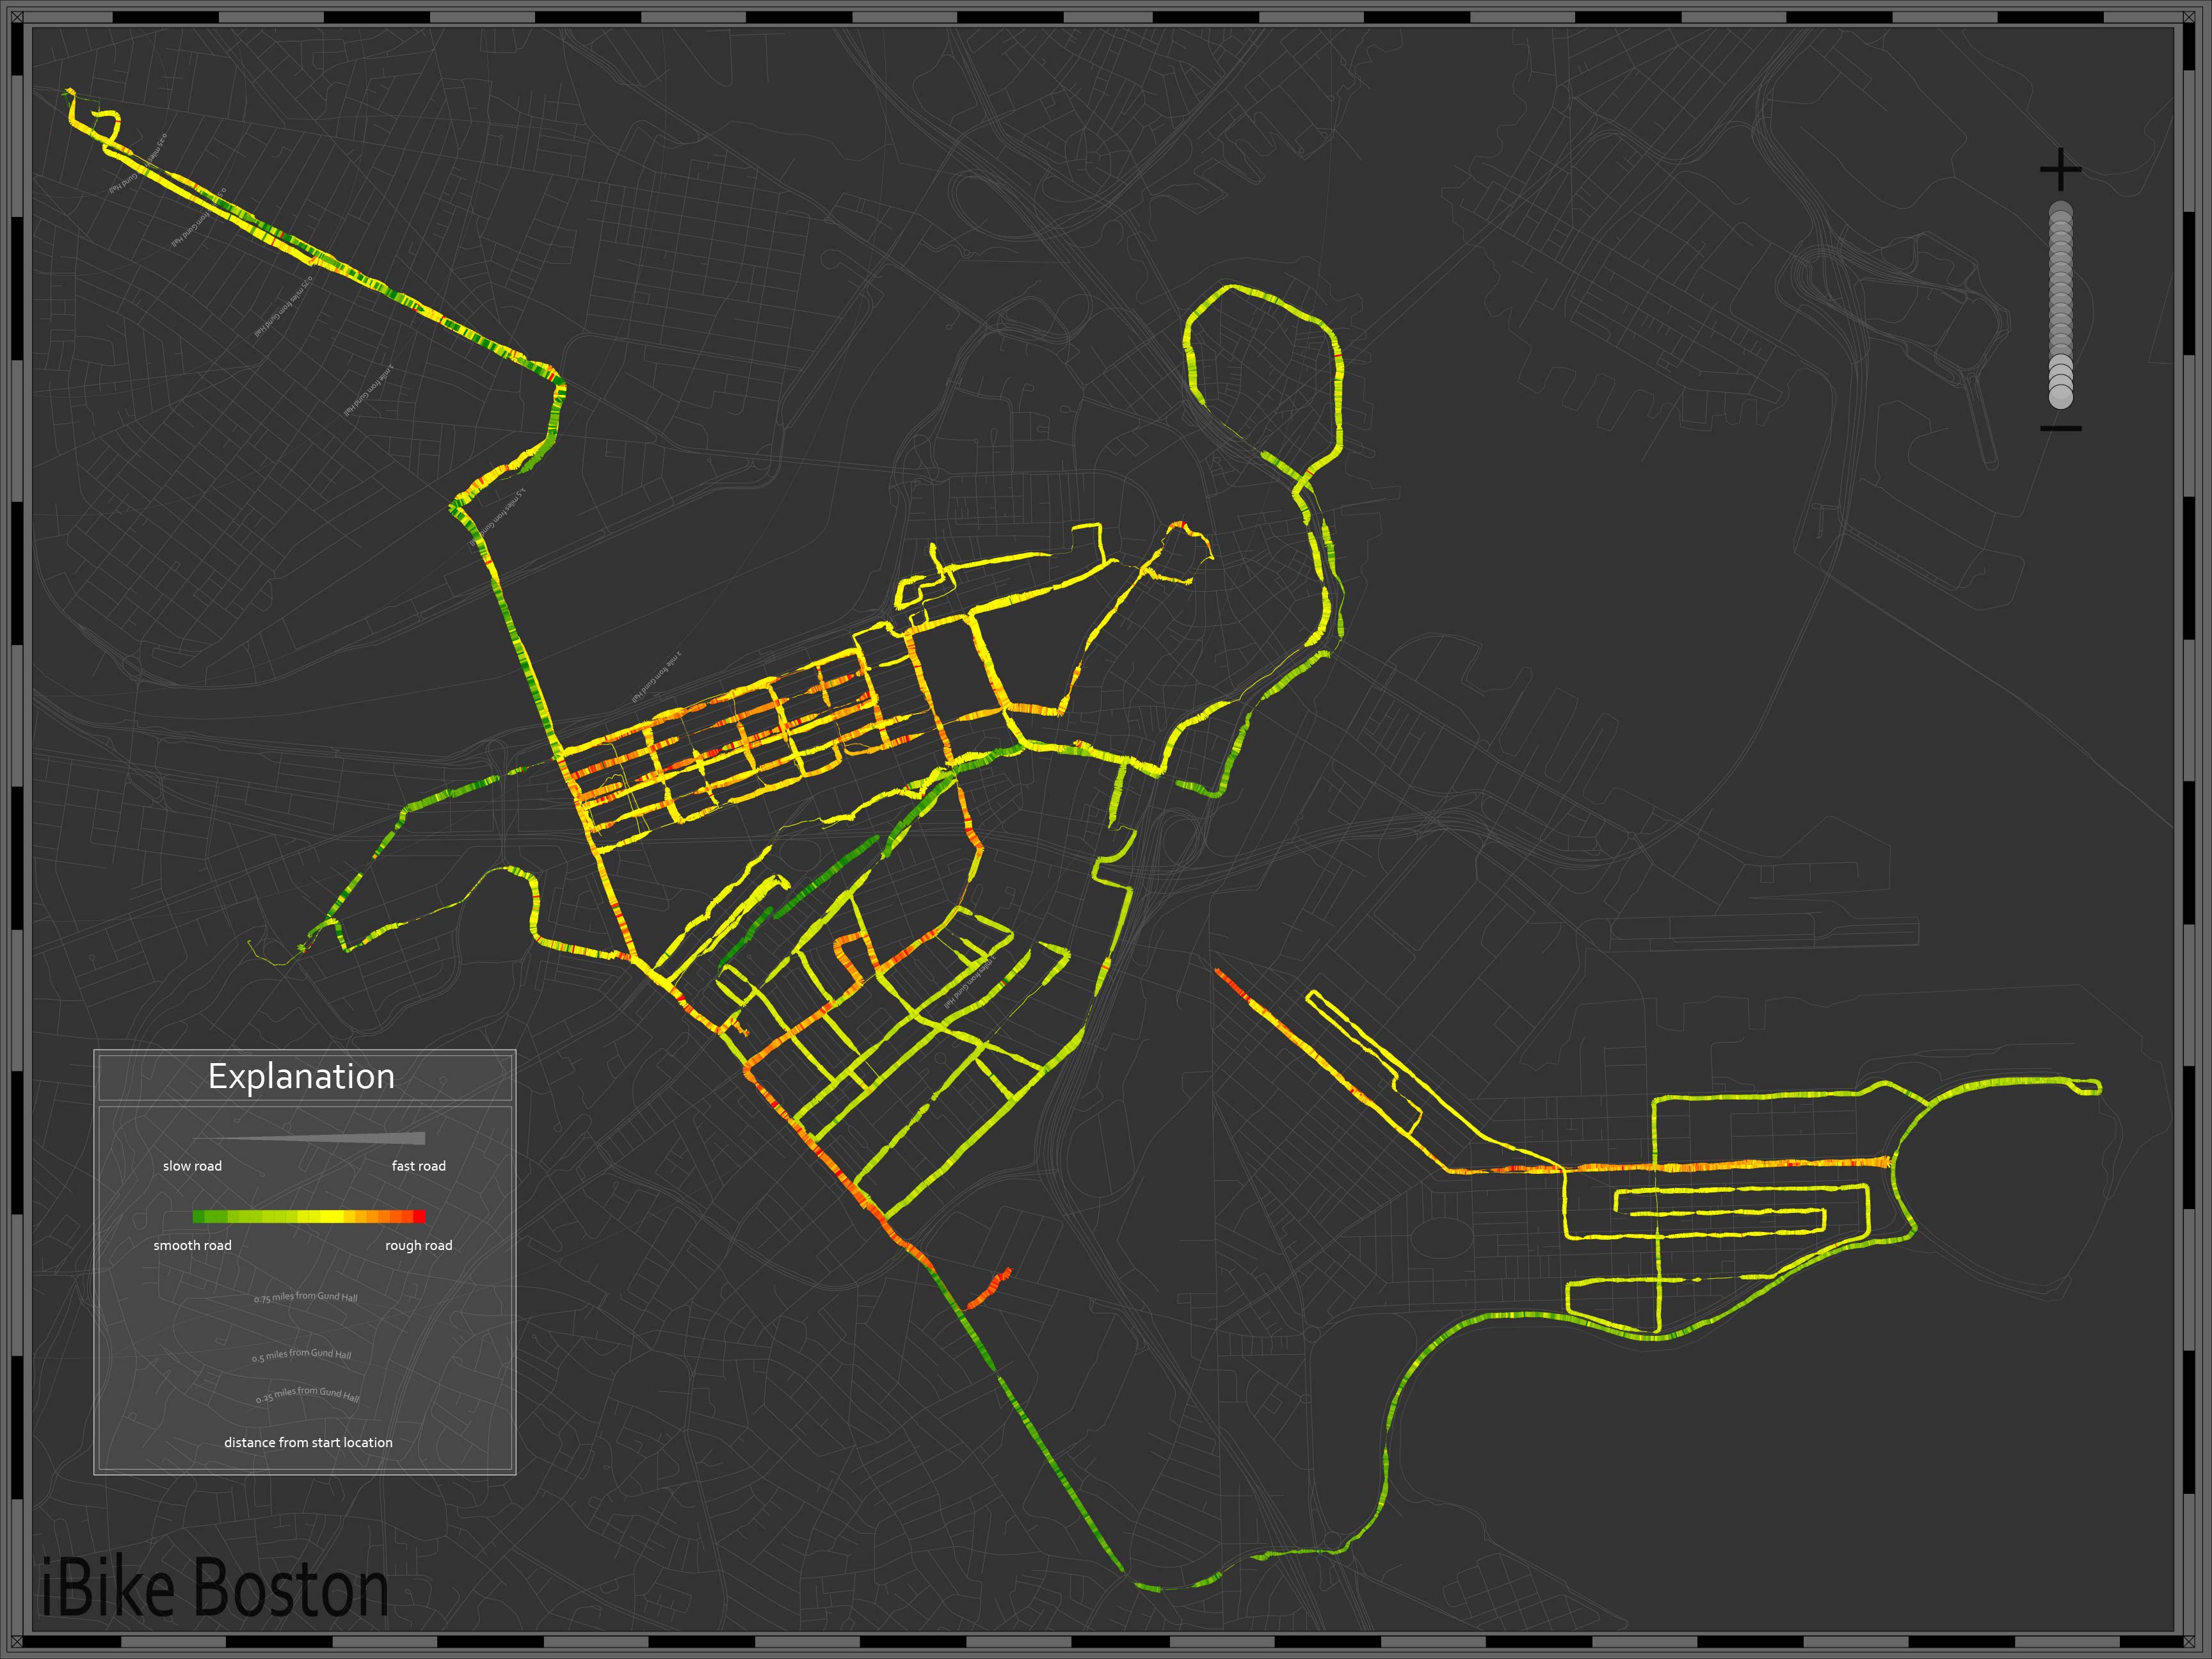
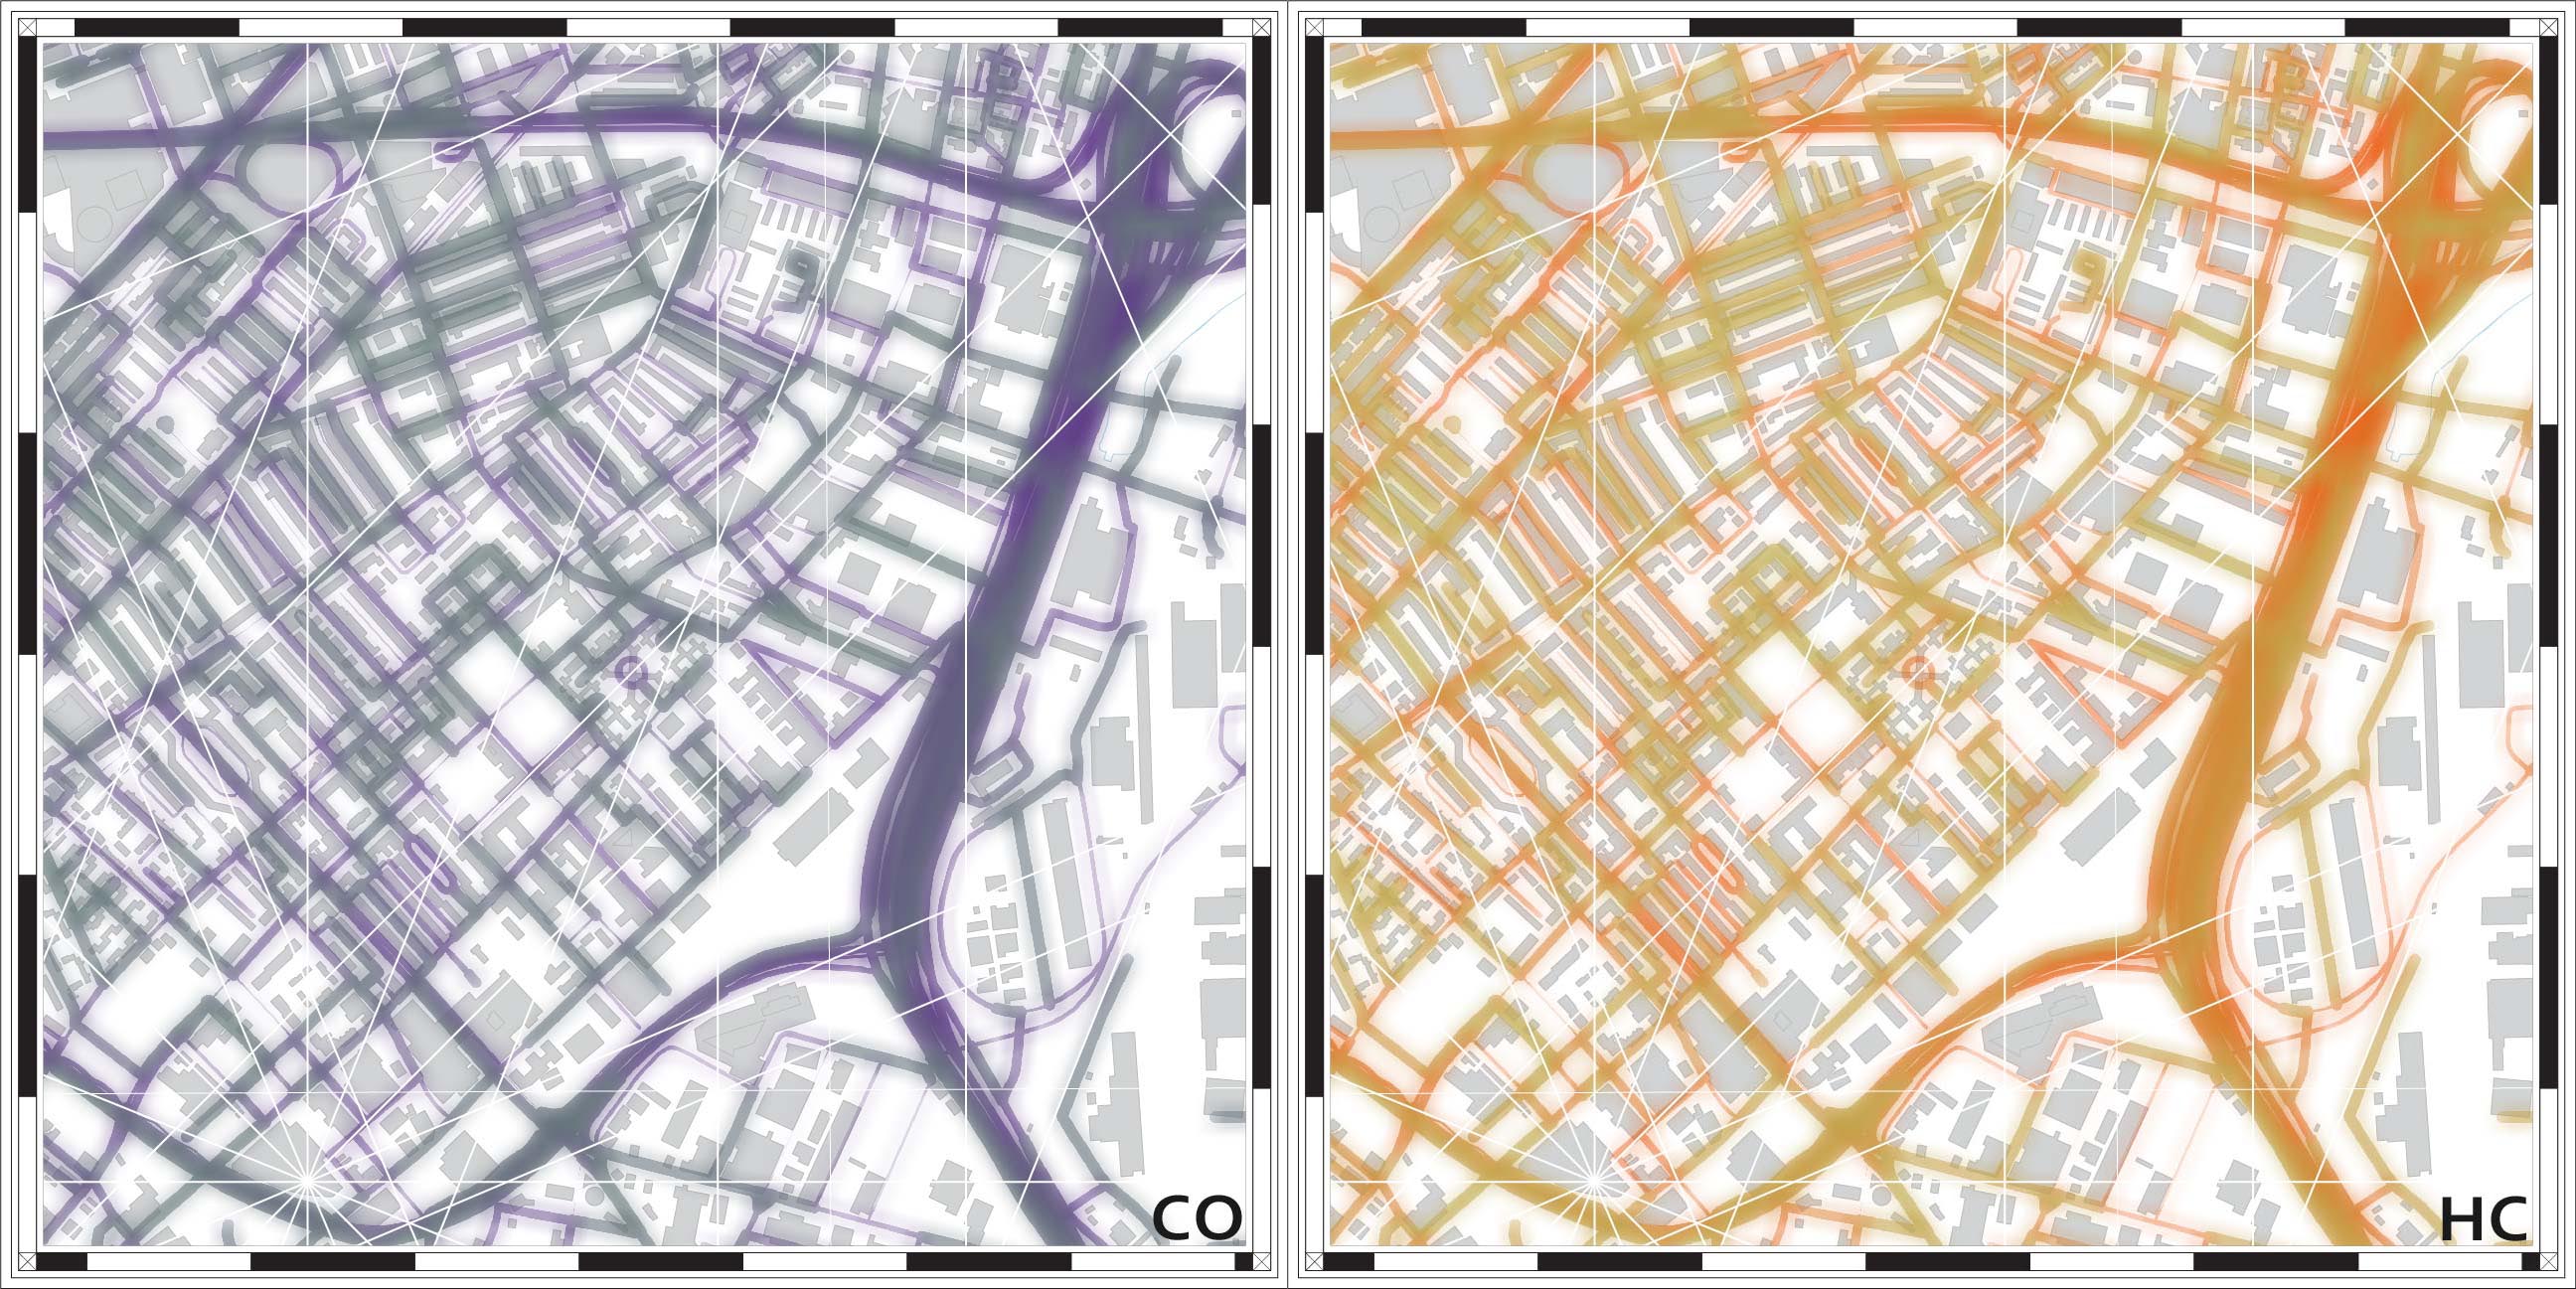
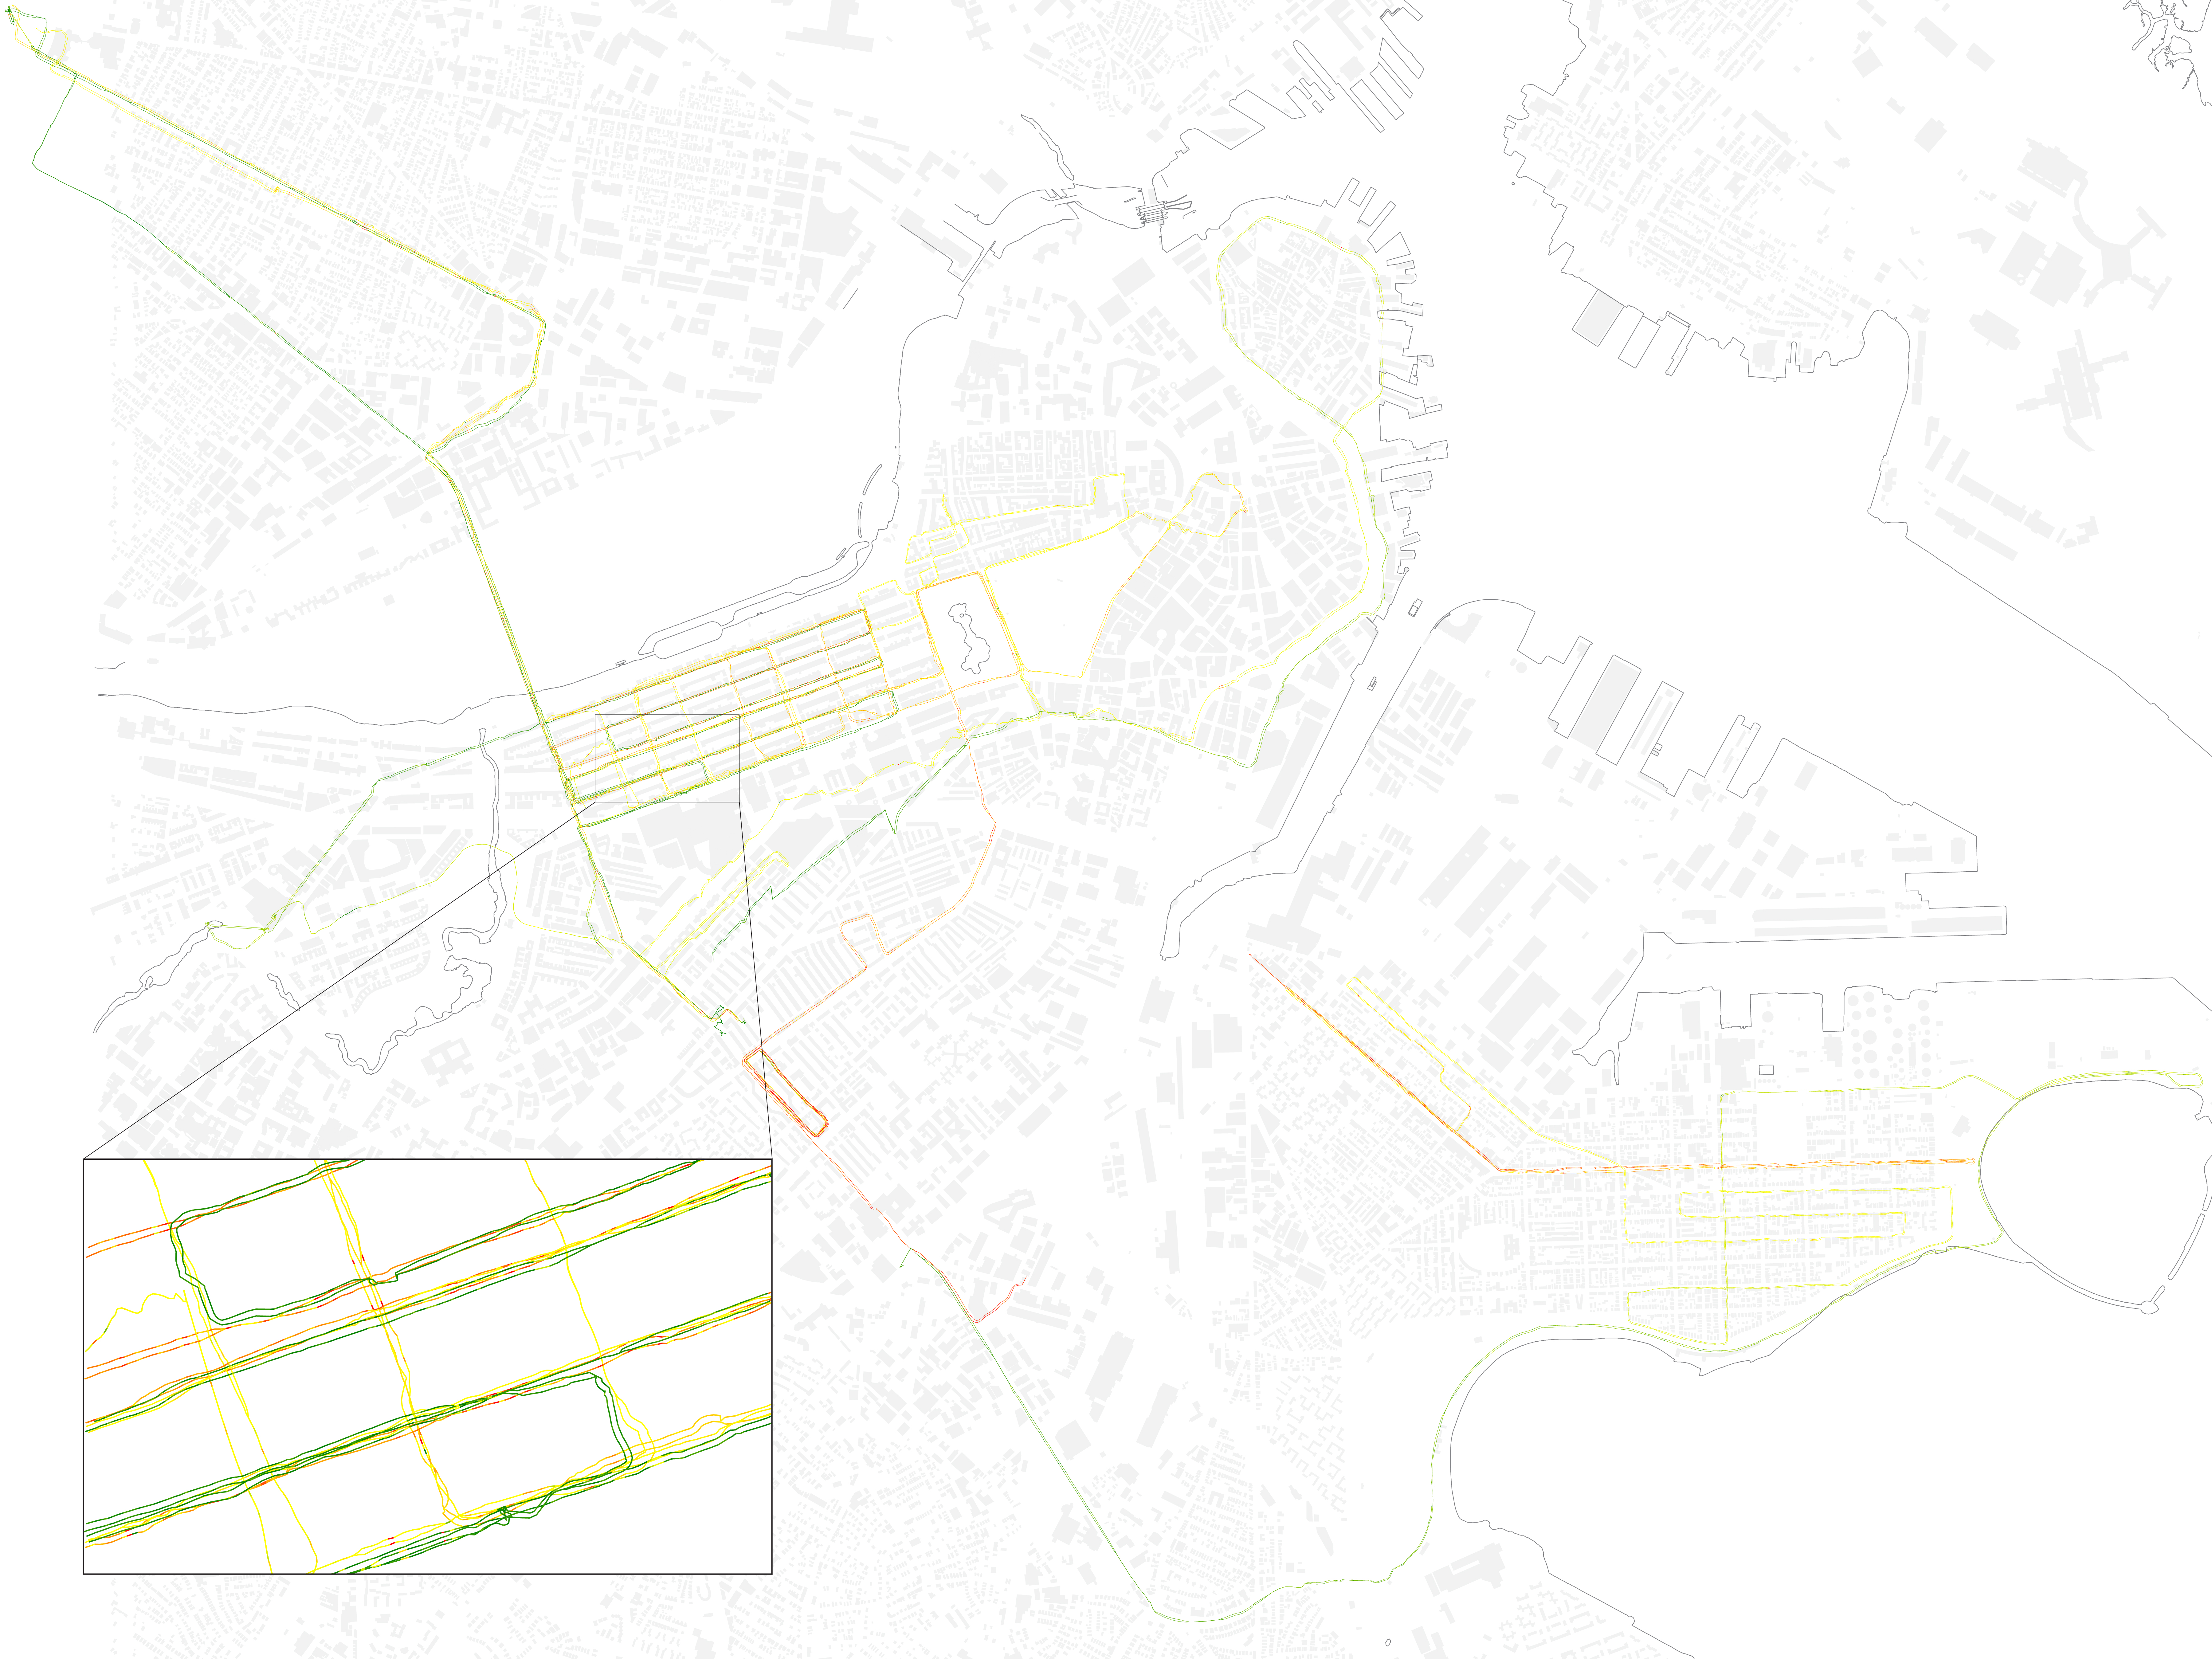
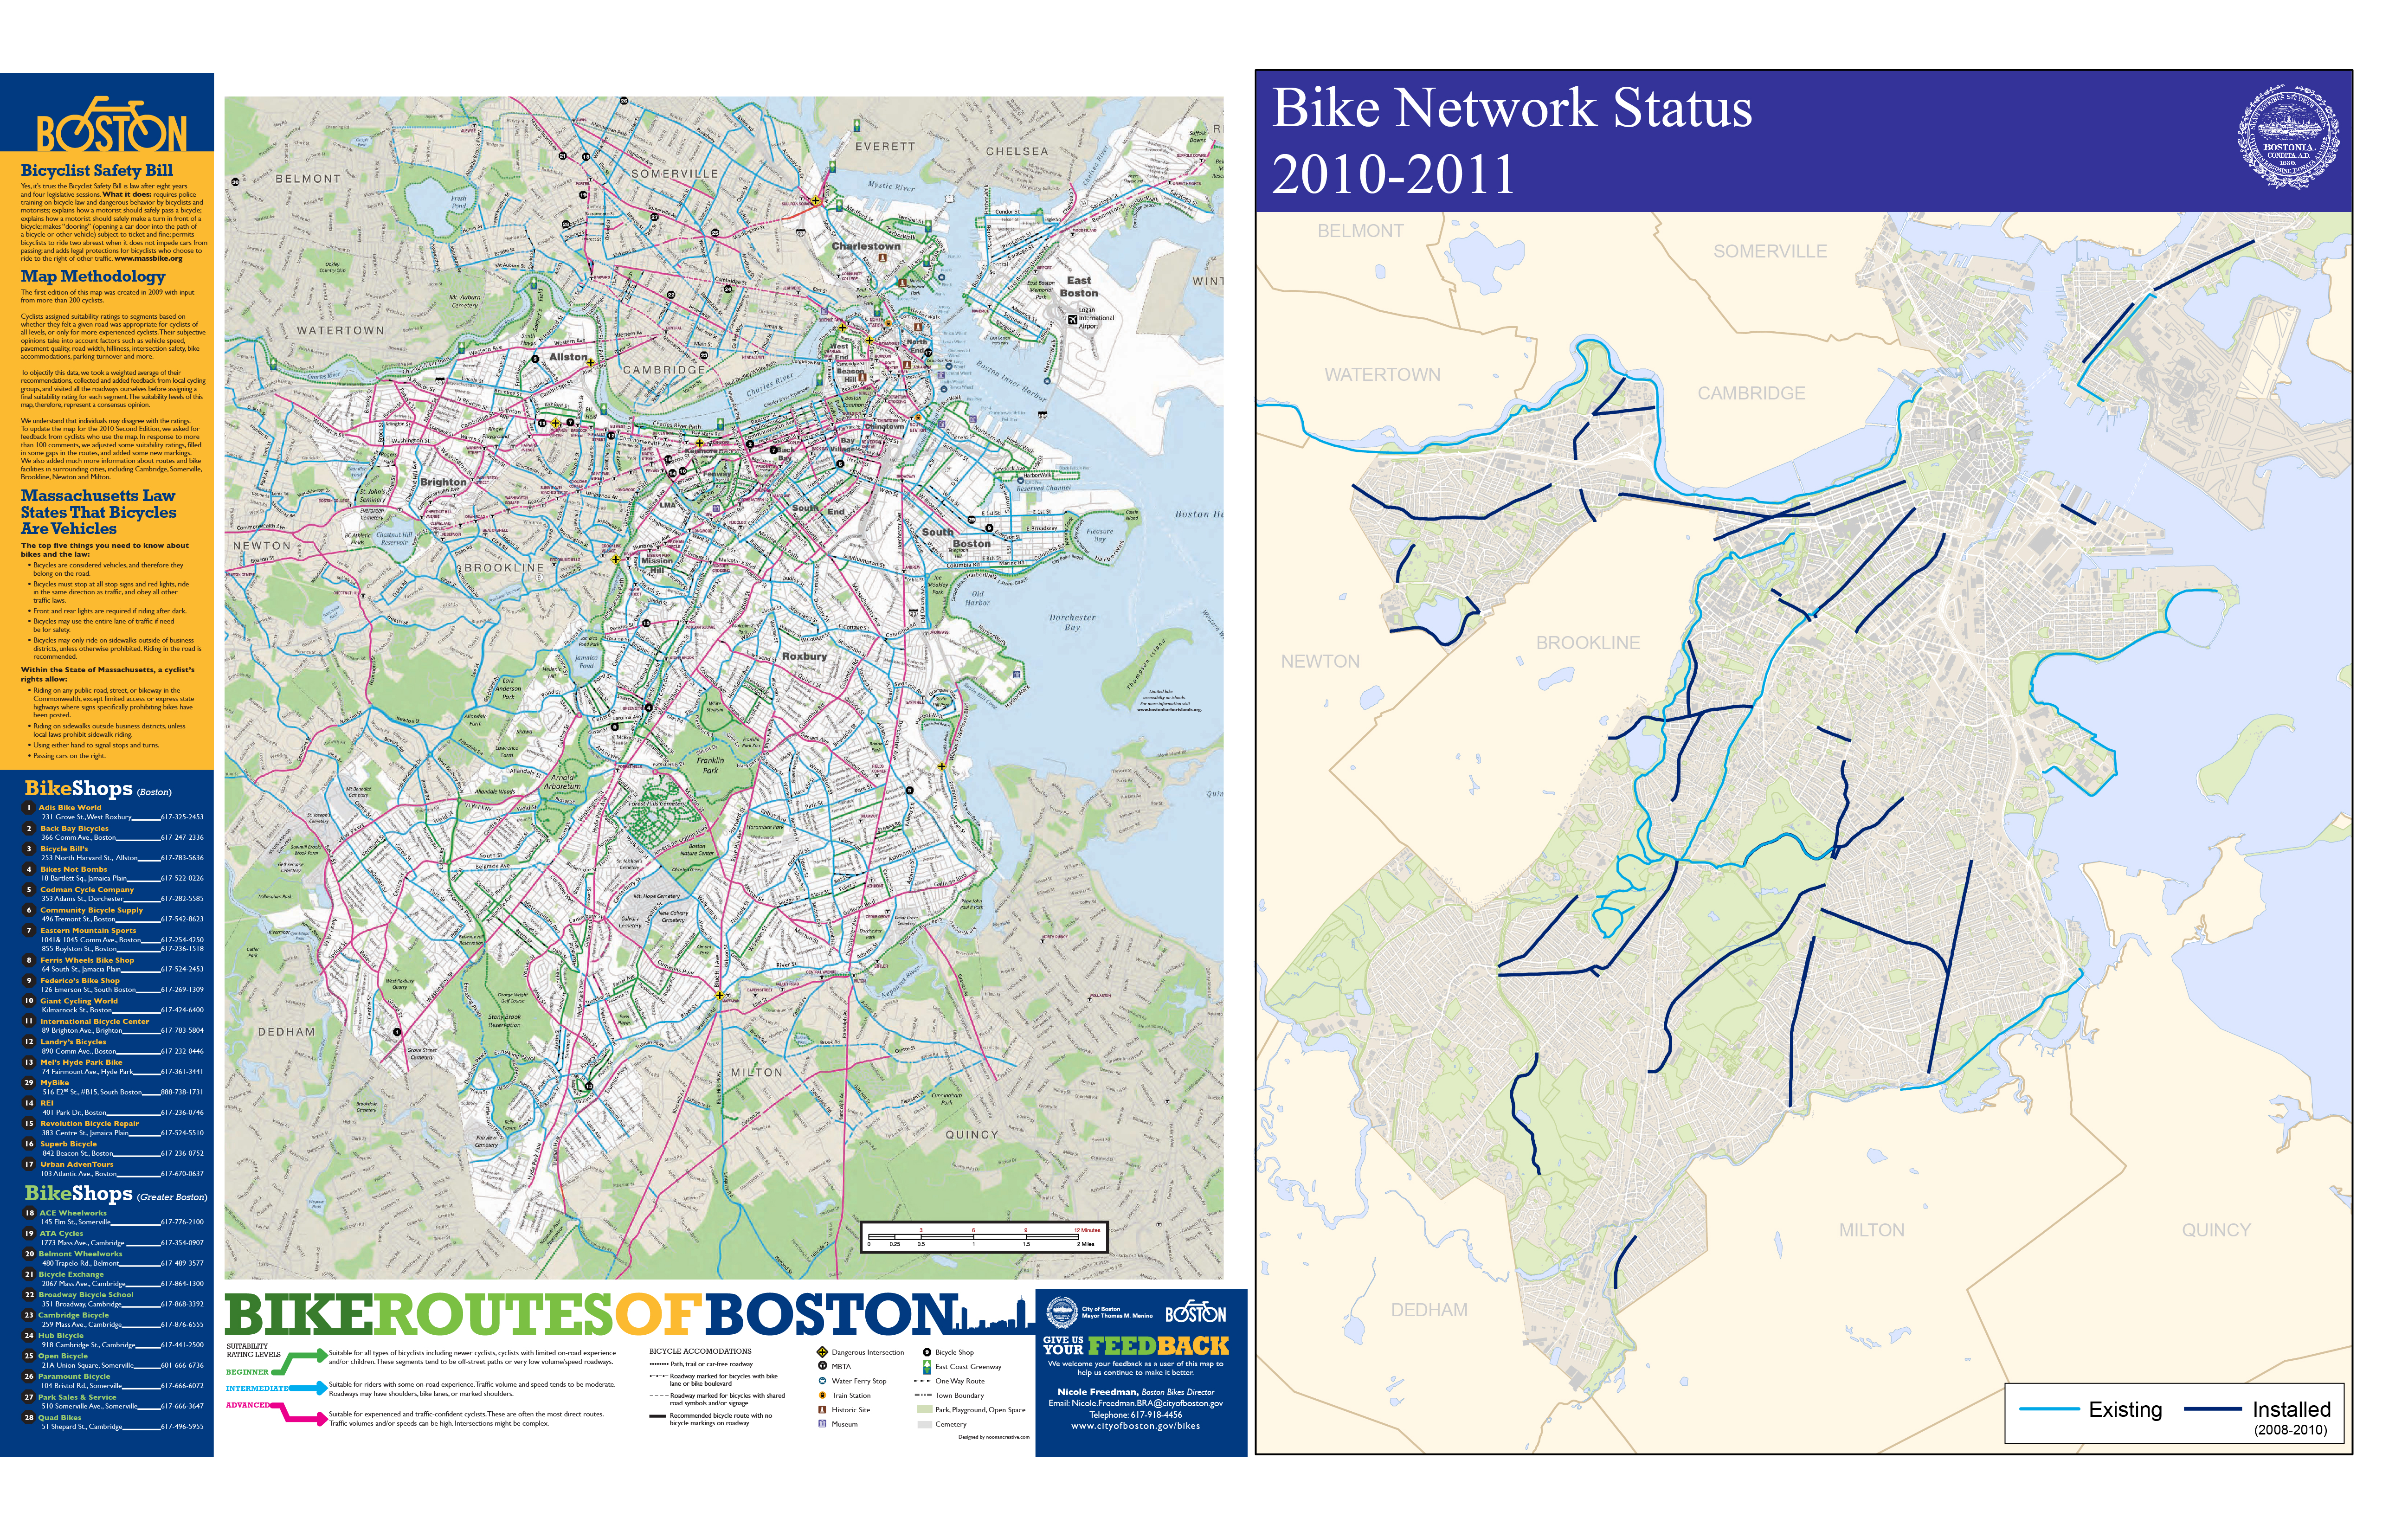
iBike, questions both the data collection as well as the dissemination. By mounting specific sensors to a bicycle data was collected in an effort to draw the experience of cycling in Boston. Using an accelerometer to measure micro-topography and a GPS to geo-locate the information and to provide speed data, I am questioning the existing maps by redrawing the city based on the experience of cycling. The width of roads is drawn based on the speed of travel (faster roads feel wider) and the micro-topography is drawn by increased density of marks when viewed at the neighborhood scale and as a color gradation at the larger scale. The resulting maps provide the cyclist with a layer of information absent in existing cycle maps that relates directly to the human experience.
iBike Boston began with a simple proposition, go out and explore Boston, discover the city. This seemed a funny proposition as Boston is my home, where I have lived and worked for eight years, having grown up in a smaller city fifteen minute to the south. Accepting the challenge of discovering my city I decided to take my bike and ride around the residential part of South Boston. I have spent quite a bit of time in Southie, but always along the water or along Broadway, the main street running through the middle. What I found was that it was nearly impossible to get from my appartment in the South End to South Boston, a distance of only about two miles. Though Boston has been making great moves to become a more cyclable city, there exist still major gaps in the infrastructure and linkages. The two mile ride to Southie bring you across a four lane intersection and on ramp over the highway and around a major rotary, the way back sends you under the highway where no cross lanes exist.
This adventure got me thinking about how different the rhetoric about Boston being a more cyclable city is from the actual experience of riding. I began looking at maps, both cycle specific as well as common digital maps. The cycle maps that if found provided little information on what the surficial conditions actually were. Cycle lanes, when represented at all, were color coded lines drawn over centerline of streets, simply denoting that a cycle lane exists with no hint at the quality or width of the lane, just a demarcation of it’s existence. The base maps that the diagrammatic overlays were applied to are similarly simplified, seemingly dependent on satellite imagery to provide any “real” surficial information.
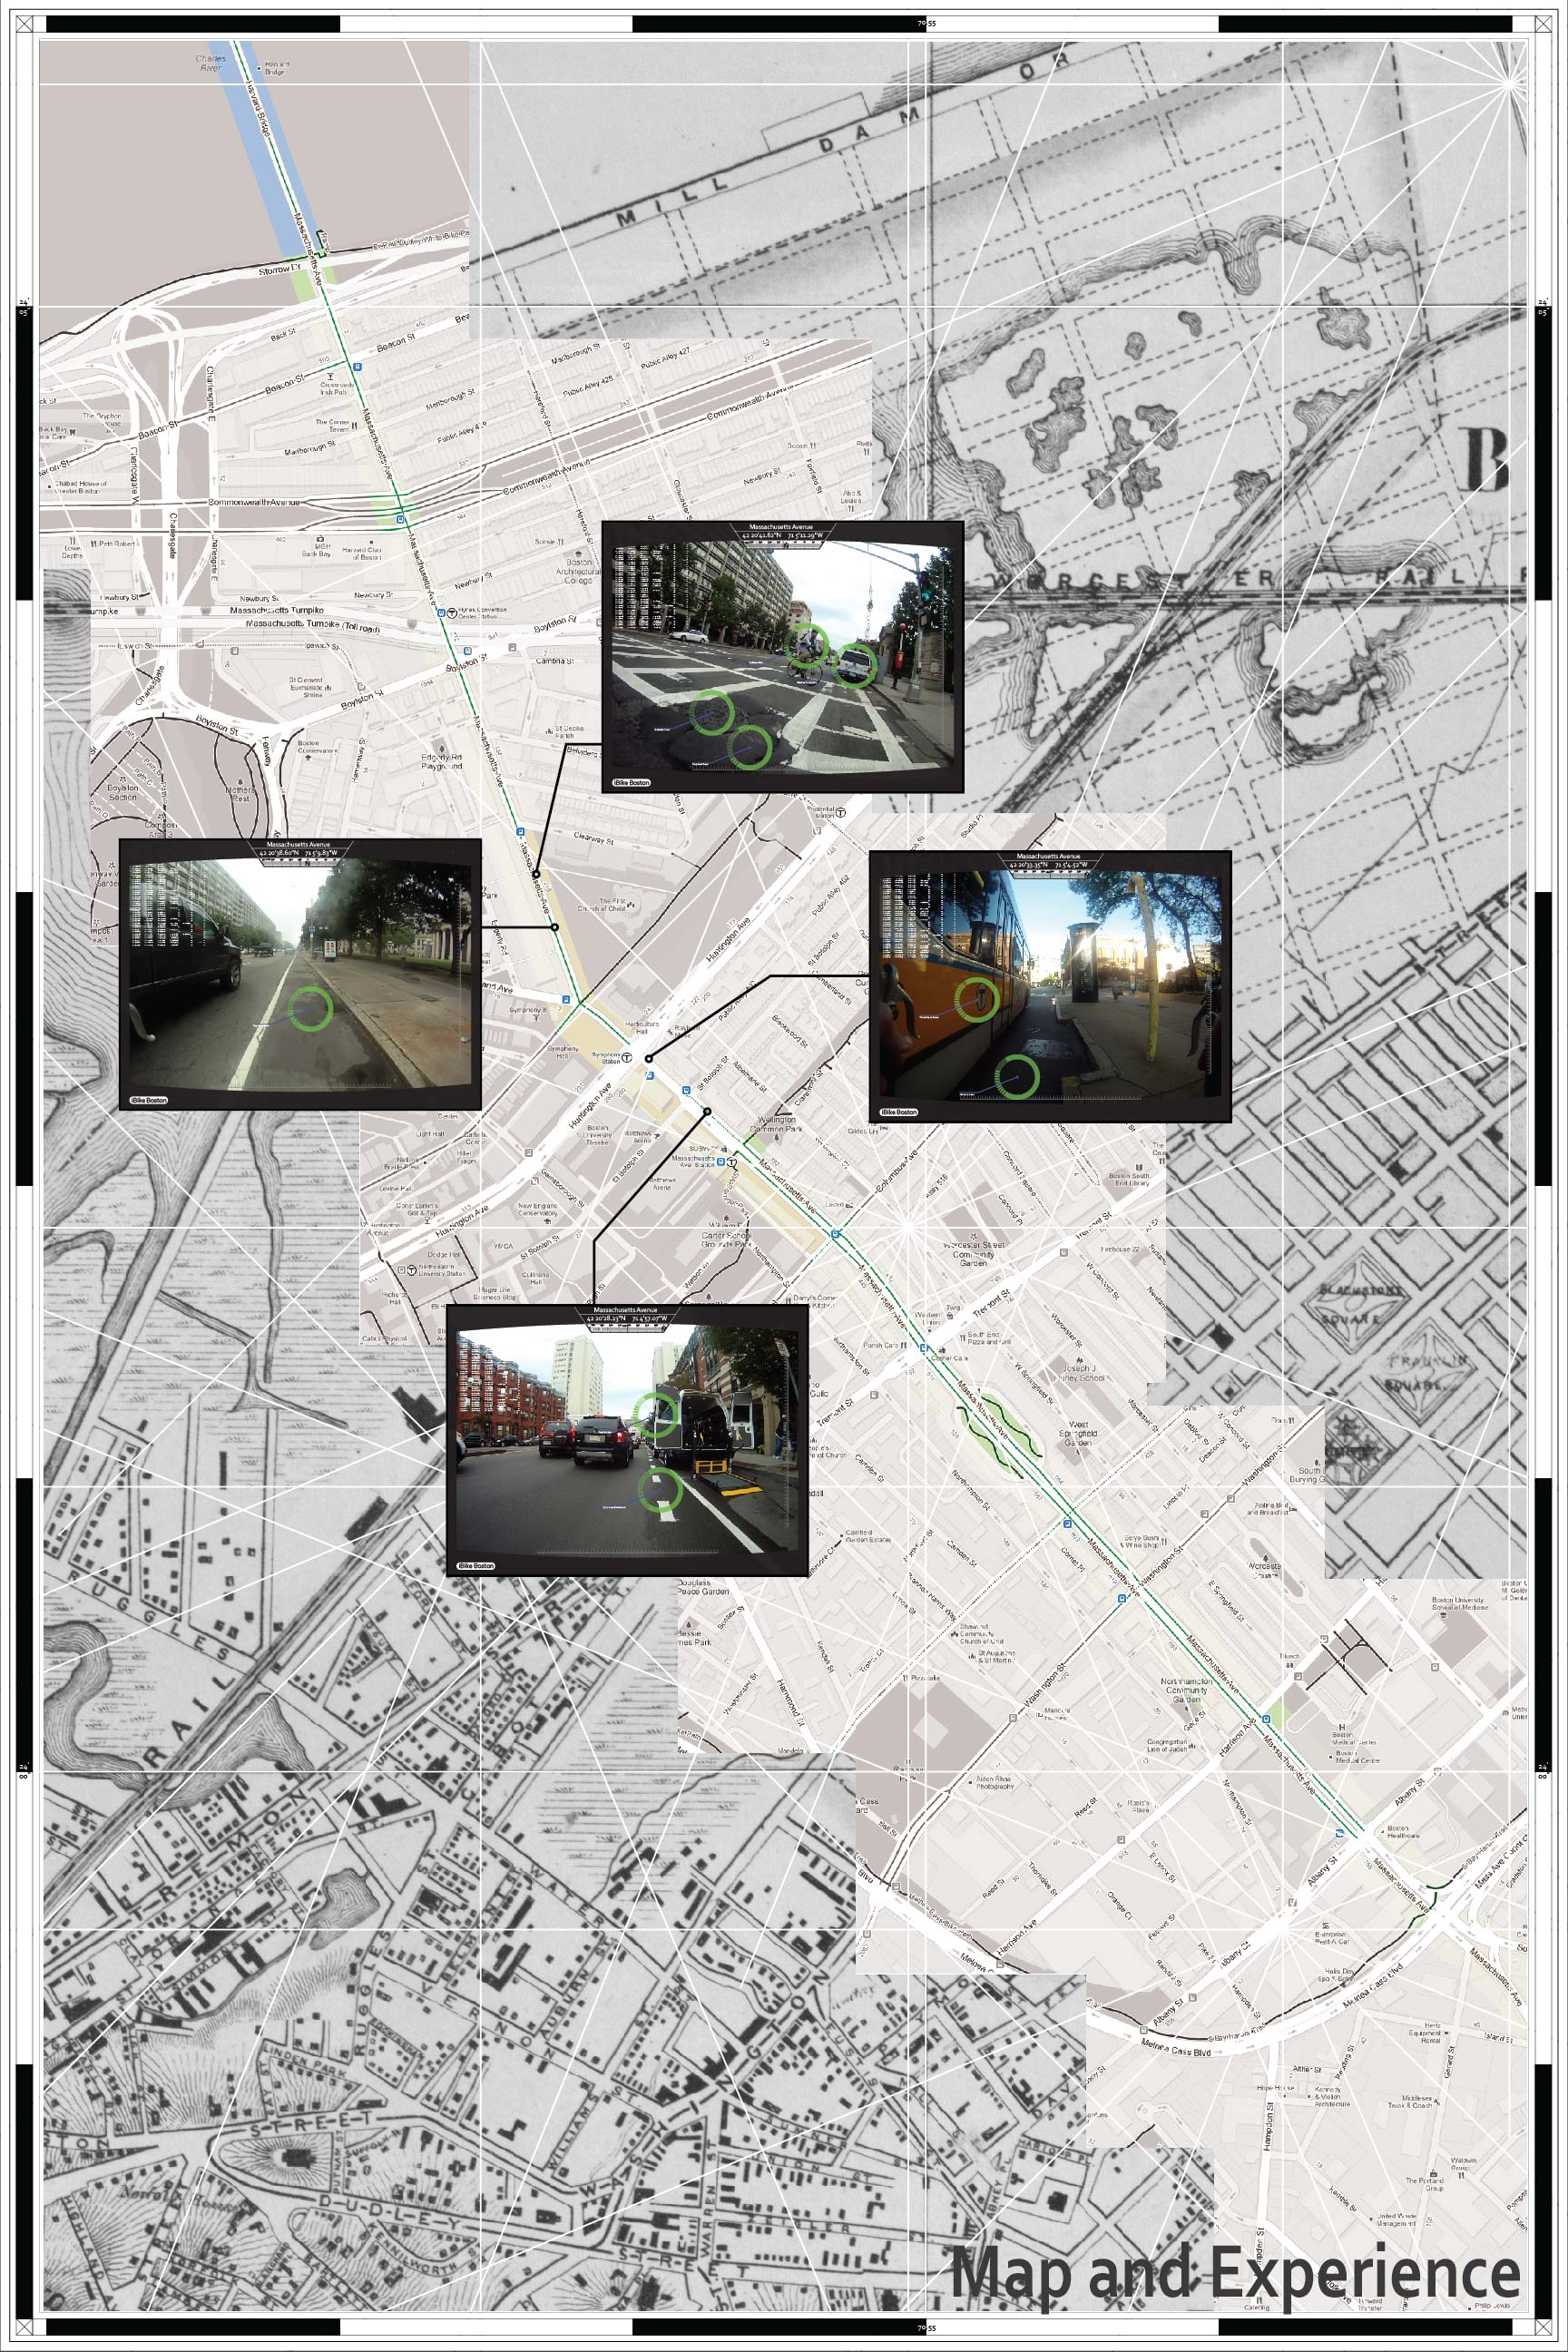
The ubiquitous google map that everyone is familiar with stands as a contradiction to the access of huge amounts of data. The flattened surface of the “map” view juxtaposed with the satellite imagery layer are presented as a complete picture of the world, encompassing all of the resolution necessary. With this dichotomy of the ultra simplified map and satellite imagery a certain thickness of information that had been drawn into maps for centuries has been wiped away. Further, the ubiquity of data collection devices (smart phones with gps, etc.) bring to question why modern cartography has largely been simplified (perhaps because of the ubiquity of data collection and dissemination).
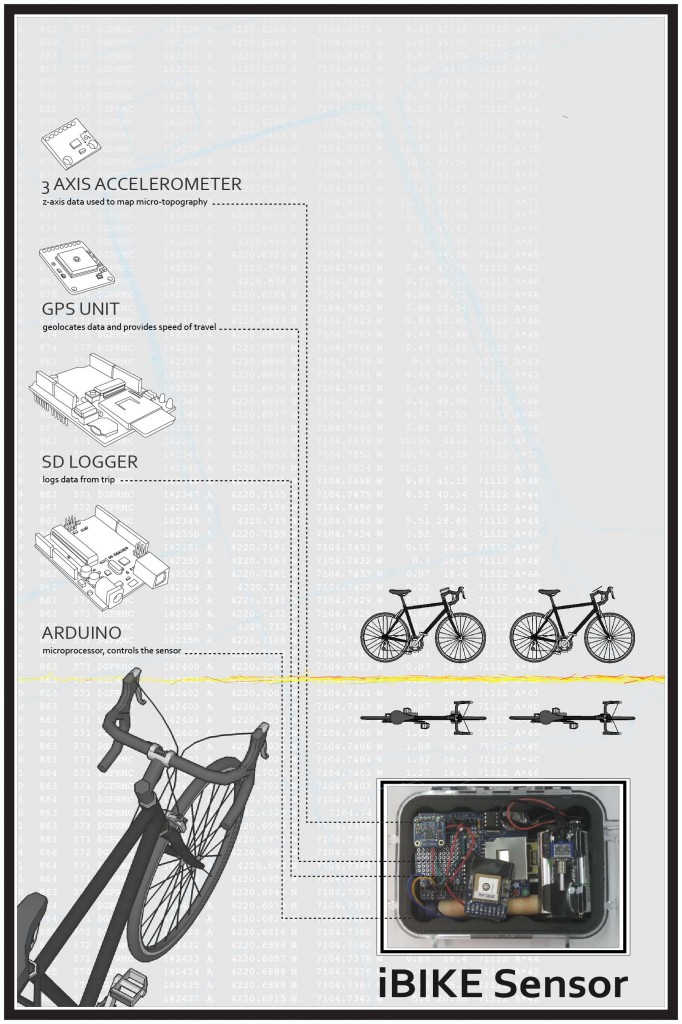
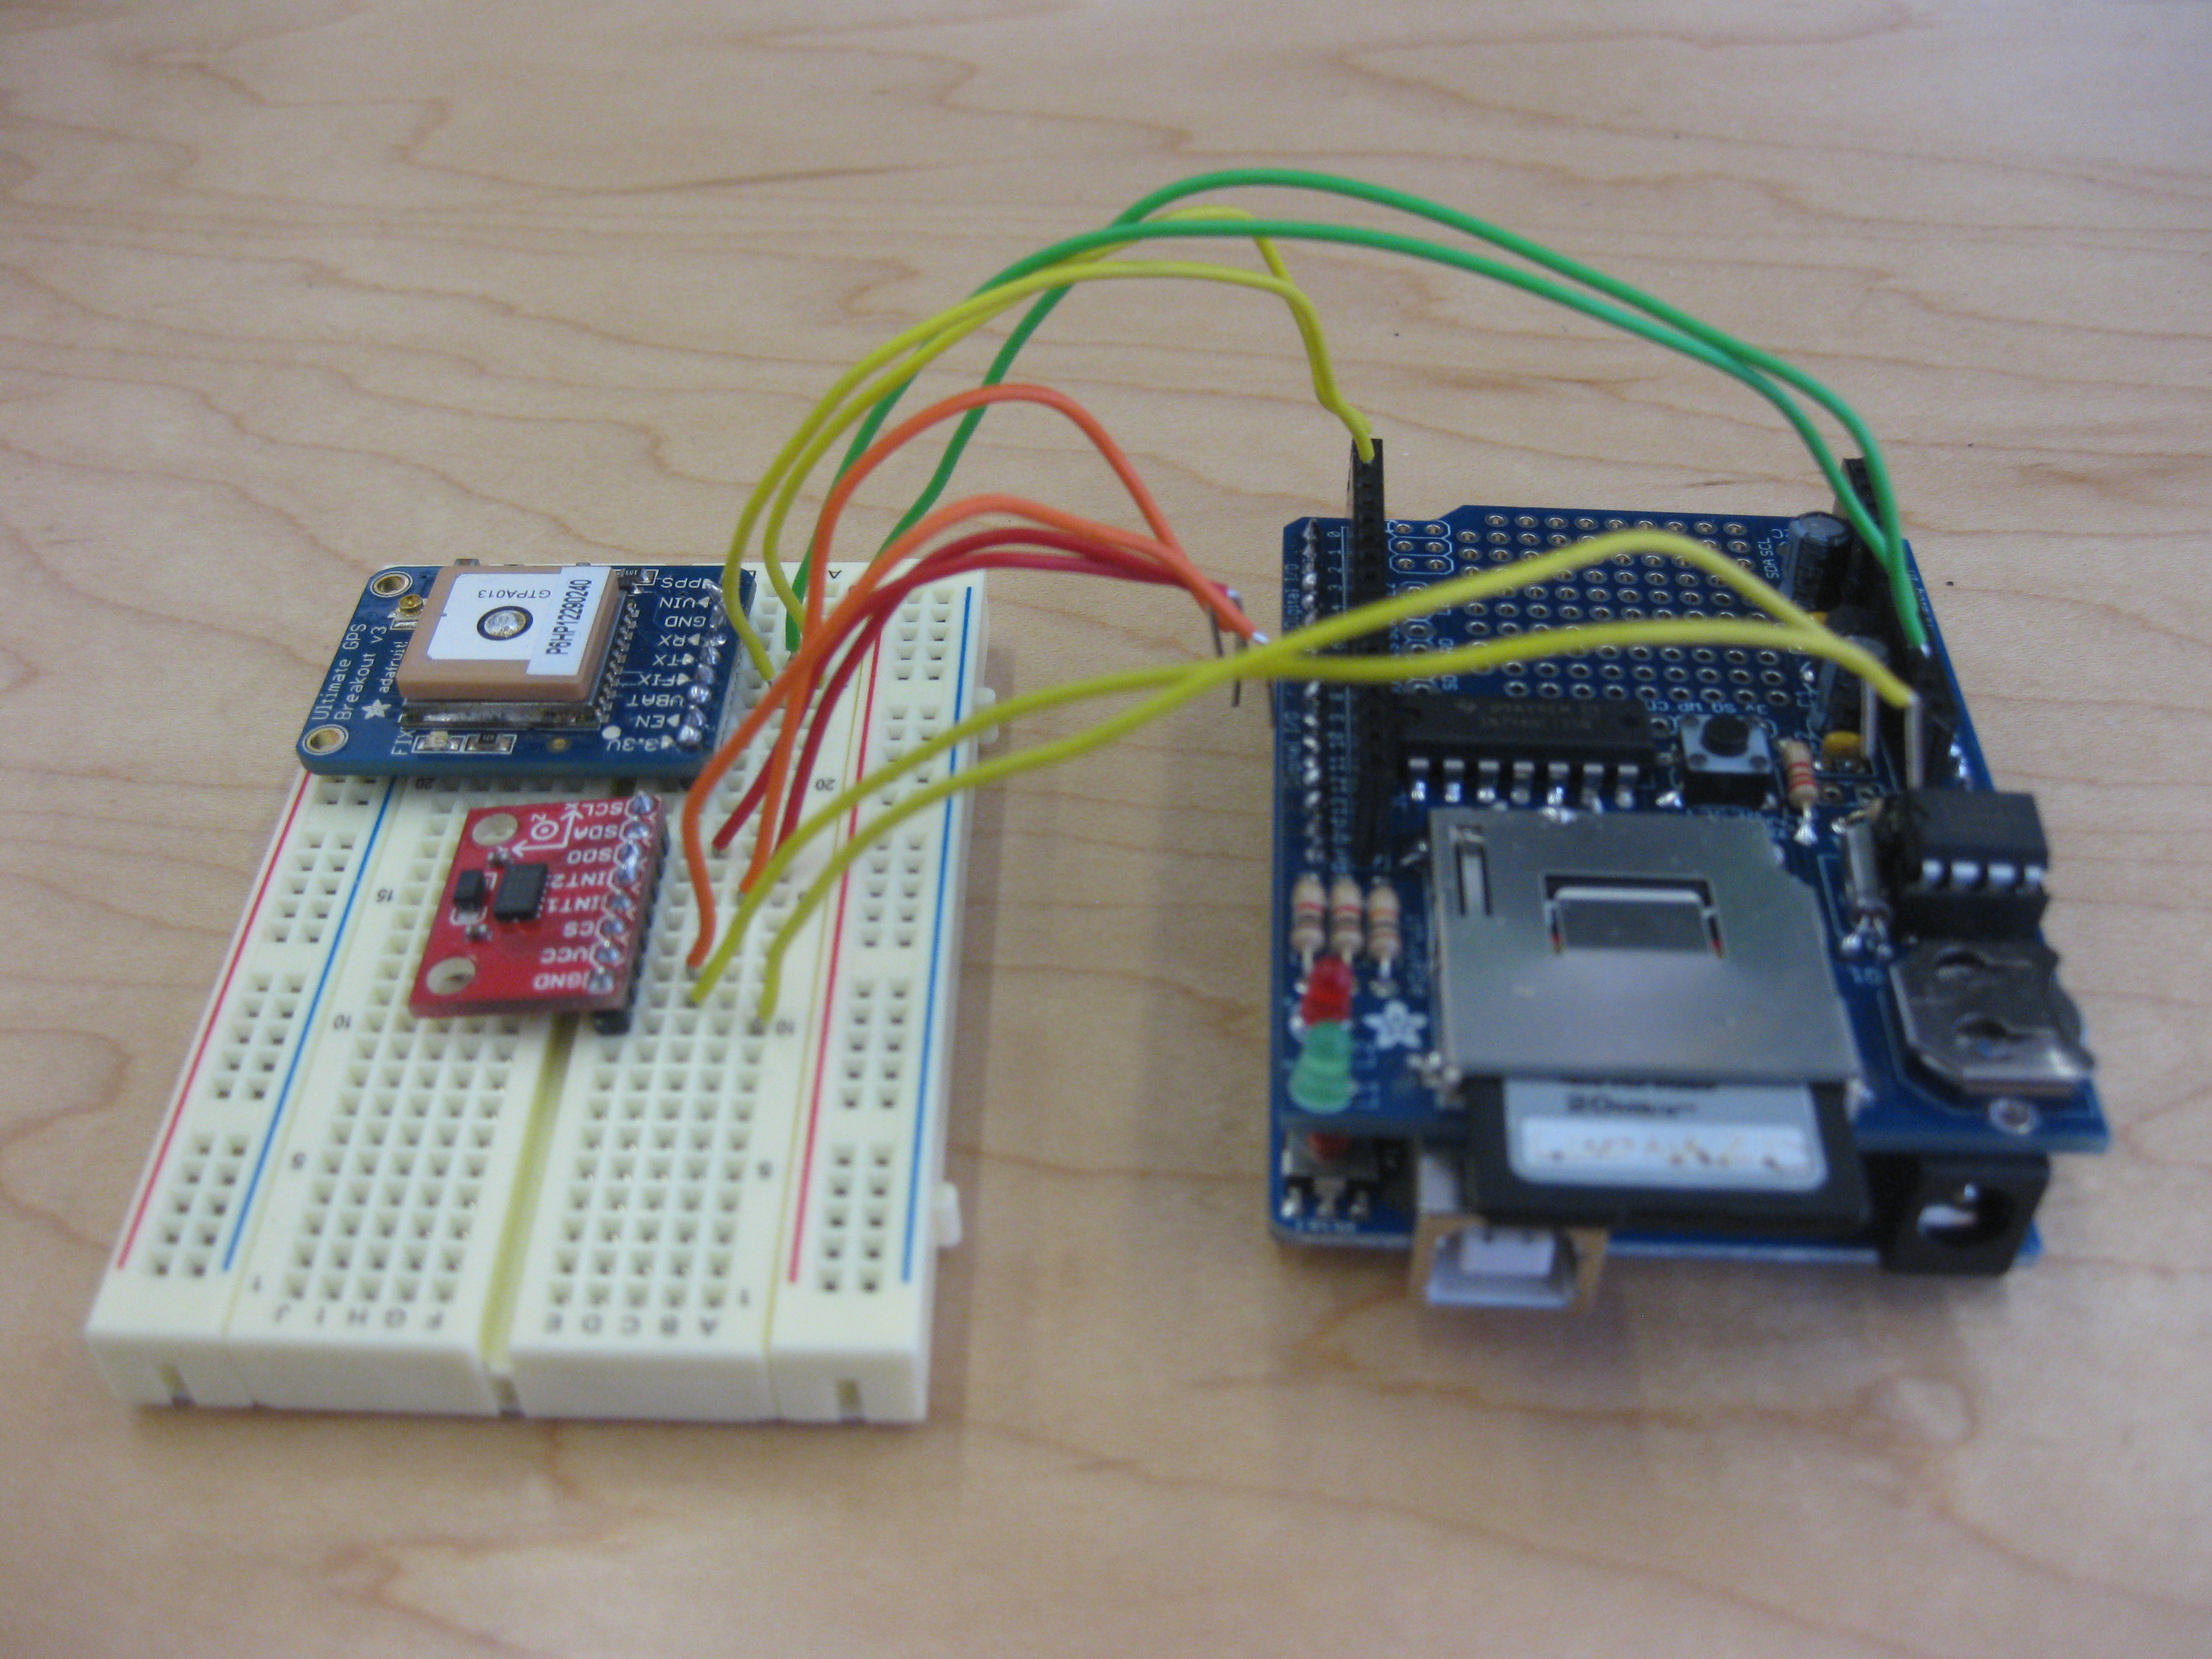
From this research I decided to explore how a thicker more informative cycle map could be drawn, to remap the city drawing the experientiality of cycling. To do this I built a sensor to mount to my bike in order to map data related to the experience of the ride. I focused in on two parameters to map, micro-topography and speed. I used an accelerometer to map the micro-topography; using the z-value from the inertia sensor I was able to map the feeling of the road while riding. A GPS was used to geo-locate the information and to provide speed data. The width of roads is drawn based on the speed of travel (faster roads feel wider) and the micro-topography is drawn by increased density of marks when viewed at the neighborhood scale and as a color gradation at the larger scale. The resulting maps provide the cyclist with a layer of information absent in existing cycle maps that relates directly to the human experience. The limited parameters of micro-topography and speed provide quite a bit of information pertinent cyclists, as the yare two major factors in the comfort of a ride. Additionally the use of the accelerometer and GPS allows for future scalability as most, if not all, smart phones have these two sensors built in. With the intention of turning this into an app crowd-sourcing data iBike can redraw the city based on the experience of cycling temporally, showing conditions as they change. The maps have the ability to transition as road change, construction begins and ends, even diurnal maps can be created so that the cyclist can better understand what the riding conditions are likely to be when they set out.
![0.18_Park_1 [Converted]](http://networkedurbanism.com/wp-content/uploads/2012/12/Park-and-Back-Bay.jpg)
Developing into the future I am looking to formalize iBike Boston into a crowd-sourced digital mapping system, drawing thick user based maps that redraw the city based on experience. Additionally I am developing sensor packs to measure other inputs that affect the quality of cycling. By collecting and mapping this data I am looking to impact the way we urbanize our city and environs, the city exists as a system of people, not of cars and our infrastructure should reflect that.

Bikenapped is an online platform aimed at raising awareness and mapping bike thefts in Boston. For the public, Bikenapped serves as a place to get a clearer picture of the bike theft problem as well as a community to share your experiences with others. By offering a way for theft victims to reach out to each other, we can learn from our collective experience and band together to help find solutions. The data and narratives that the public provides are valuable as insight to help understand theft patterns and behaviors, as well as the immaterial value of cycling in our city. With better information we can help pursue policy change that can target the problem.
![]()
As Boston works towards becoming a world class bicycling city, promotion of cycling and cycling infrastructure has resulted in significantly rising ridership. However, this increase in cycling correlates with another phenomenon: the dramatic increase in bicycle thefts.
Bike theft is notoriously difficult to investigate, and stolen bicycles are equally difficult to recover. Theft victims often feel violated and helpless in the face of these crimes. There is nowhere for to speak out, no outlet for to take action. By gathering this community of individual voices, we can speak with a collective voice to shed light on the problem, and work together to find solutions.
MAPPING THEFT
One of the issues regarding bike theft lies in the shortage of data on these crimes. According to the reports from the Department of Justice, for every bike theft that is reported to the police, 4 or more thefts may have occurred. This severe underreporting prohibits us from seeing the full scope of the problem and from allocating adequate resources to tackle it. Bikenapped asks the community to participate in a user-generated mapping of theft incidents, to share information with our neighbors and our city.
TAKING ACTION
Raising awareness and disseminating information is crucial in addressing bike thefts. We seek to take the data beyond the digital realm and into the real urban environment we live in. Bikenapped asks users to post notice at the physical place of the theft to warn others of what had happened. The information is not just relevant on the internet, it is more relevant to all the people who use the spaces where these thefts happen.
CONNECTING VOICES
Change happens when we empower everyone to act. While bike theft is something most people experience alone, Bikenapped seeks to connect us with our neighbors and community. If we discover other people had their bikes stolen from the same place as ours, perhaps we can join together to demand for better safety measures in our neighborhood. If law enforcement is aware of certain zones of bike thefts, perhaps they are better equipped to police the area. If we know bikes have been stolen from a particular place, perhaps we will all be more vigilant to keep our neighborhoods safe from bike theft.
PROCESS AND THOUGHTS
The project began through data collection. Through visiting police departments and combing through public log information, we can already begin to see the difficulty in just understanding the bike theft issue in Cambridge. In just the city of Cambridge, there are three separate police departments that holds jurisdiction over different areas: the Cambridge Police Department, the Harvard University Police Department, and the MIT Police Department. In addition the MBTA Transit Police oversees all transit stops. All of these police departments have separate reporting and record keeping methods, which are not collated into a single database, but rather organized internally. From any one source, we can only see a narrow segment of the larger problem. It became clear that in order to understand the issue, we needed a place where information can be collated and made accessible to the public.
Bikenapped became a platform to not merely disseminate information, but also encourage participation. Bike thefts suffer from severe underreporting due to the common perception that nothing will come from a police report. Though the rates of recovery are surely low – and Bikenapped makes no claims at increasing the chances of recovery – a report on Bikenapped is something theft victims and see. It is visible on the map, and visible to every person who comes to visit it. A piece of information or an experience where a victim had once suffered alone, is now directly and visibly a contribution to a larger story and effort.
The reaction to Bikenapped has been extremely positive. As different media outlets and cycling blogs began to pick up the story, reports and emails started coming in. We had over 2500 unique visitors within the first 12 days, many from beyond the borders of Boston/Cambridge, all the way from Portland and California. The issue surely struck a cord to people, and the support and response that Bikenapped received validated the need for its existence.
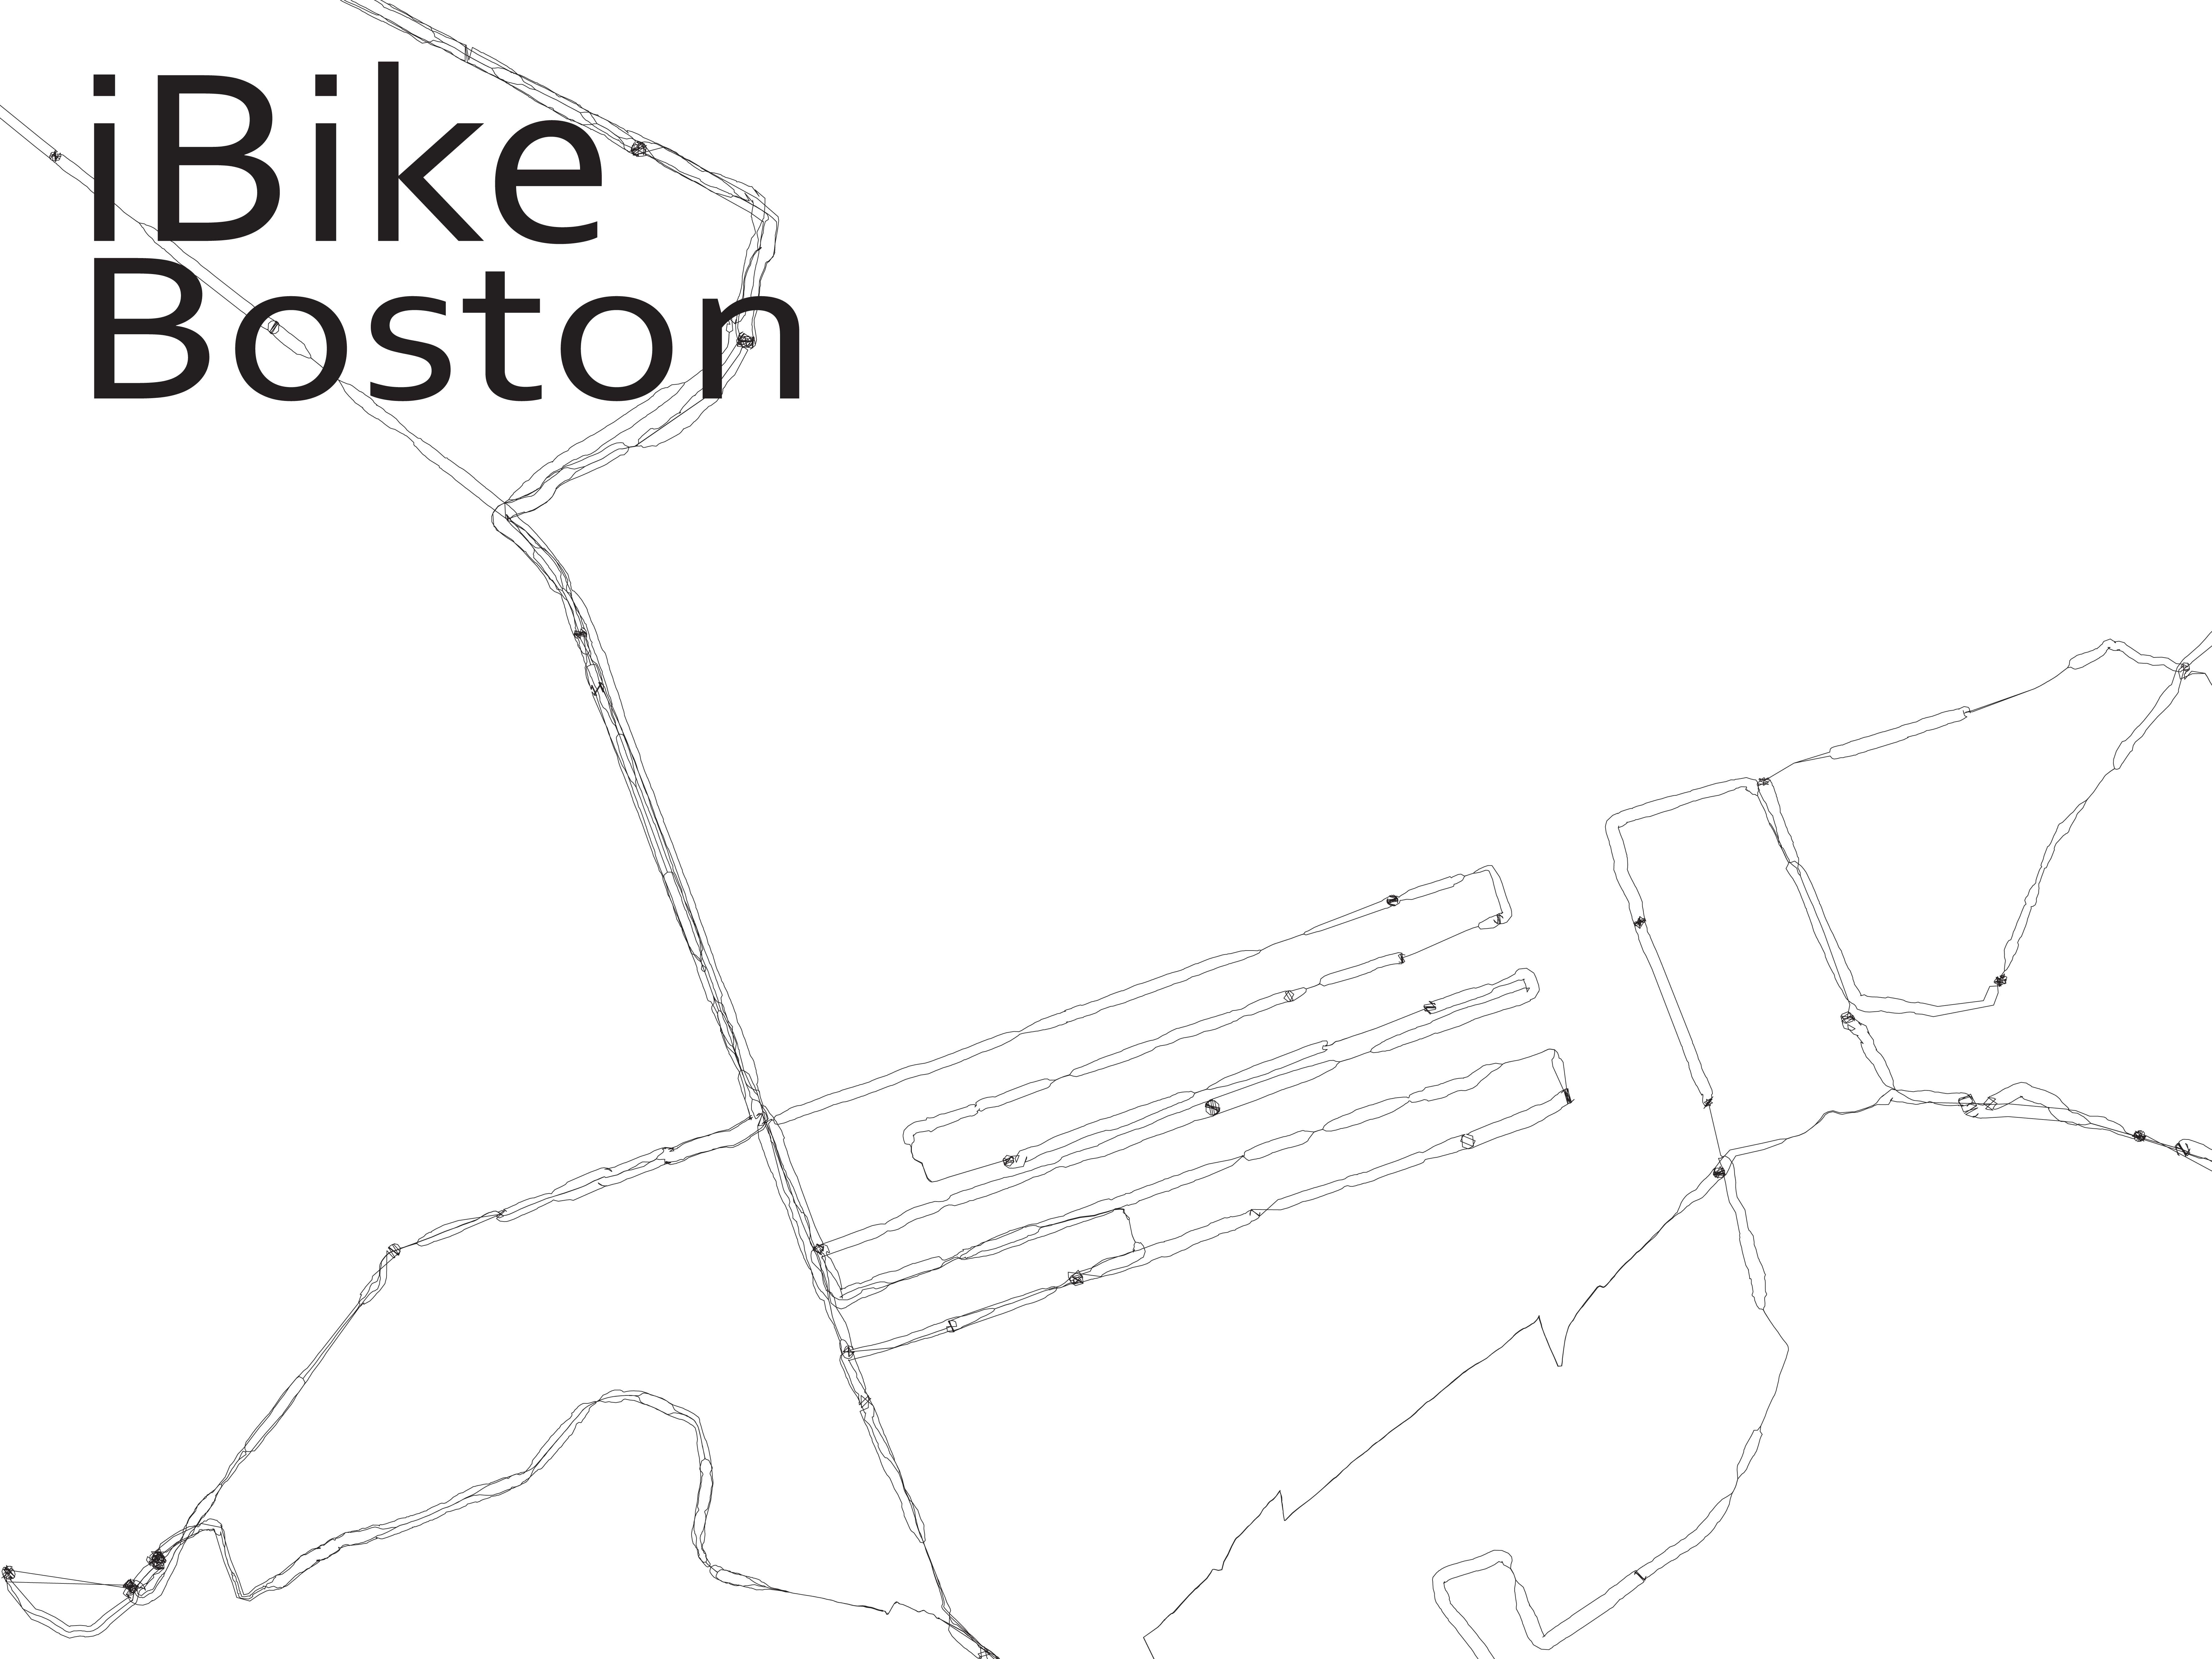
iBike Boston is a project on re-mapping the city of Boston in an effort to draw the experience of cycling in the city. By mounting a sensor that links accelerometer and GPS data to the handlebars of my bike and riding the city I have been mapping the micro-topography of the streets and the speed of travel, this information is used to redraw the streets to better show the experience of riding in Boston.

Bikenapped aims to raise awareness for bike thefts and empower cyclists to take action.
As Boston works towards becoming a world class bicycling city, promotion of cycling and cycling infrastructure has resulted in significantly rising ridership. However, this increase in cycling correlates with another phenomenon: the dramatic increase in bicycle thefts.
Bike theft is notoriously difficult to investigate, and stolen bicycles are equally difficult to recover. Theft victims often feel violated and helpless in the face of these crimes. There is nowhere for to speak out, no outlet for to take action. By gathering this community of individual voices, we can speak with a collective voice to shed light on the problem, and work together to find solutions.
MAPPING THEFT
One of the issues regarding bike theft lies in the shortage of data on these crimes. According to the reports from the Department of Justice, for every bike theft that is reported to the police, 4 or more thefts may have occurred. This severe underreporting prohibits us from seeing the full scope of the problem and from allocating adequate resources to tackle it. Bikenapped asks the community to participate in a user-generated mapping of theft incidents, to share information with our neighbors and our city.
TAKING ACTION
Raising awareness and disseminating information is crucial in addressing bike thefts. We seek to take the data beyond the digital realm and into the real urban environment we live in. Bikenapped asks users to post notice at the physical place of the theft to warn others of what had happened. The information is not just relevant on the internet, it is more relevant to all the people who use the spaces where these thefts happen.
CONNECTING VOICES
Change happens when we empower everyone to act. While bike theft is something most people experience alone, Bikenapped seeks to connect us with our neighbors and community. If we discover other people had their bikes stolen from the same place as ours, perhaps we can join together to demand for better safety measures in our neighborhood. If law enforcement is aware of certain zones of bike thefts, perhaps they are better equipped to police the area. If we know bikes have been stolen from a particular place, perhaps we will all be more vigilant to keep our neighborhoods safe from bike theft.
Riding a bike around the city of Boston you come to realize quite quickly that the cycle infrastructure is lacking. Even with the declaration by Mayor Menino that in Boston “the car is no longer king” and the cities recent focus on improving the cities cyclability, riding in the city is tough, scary and at times down right dangerous. The infrastructural improvements consist mostly of painted line bike lanes and Sharrows (painted bicycle arrows indicating an acceptable space within the lane a cyclist can occupy). While researching the current conditions I found that the mapping of the cycle infrastructure, and more the experience to be completely lacking. The maps of cycle lanes mainly consist of diagramatic overlays on plain google maps. I realized that there is not a map (at least I have not found one) that has the actual lanes drawn in. This type of mapping is deceiving to the rider as the system that exists is disjunct and rough with potholes and seamed pavement.
My goal first is to begin remapping the city of Boston’s cycle infrastructure to better map the experience of riding in the city. I am currently building a sensor consisting of a GPS and accelerometer to map the micro-topography in the city, additionally the speed, stops, turns and the side to side motion associated with pedaling hard will be used to redraw how open a street feels to the rider, the faster and smoother the ride, the wider the feeling of the street, the slower and more jerky the ride the narrower the feel.
From this I plan to develop an app that, though not as precise as the sensor I am constructing, has the opportunity to crowd source this data, as well as translate it back to the user, in essence creating real time crowd source mapping.
Where I Stand Now:
I am currently trying to convince all of the components of my sensor to start talking to each other. After about 15 hours yesterday I have come up with a new issue of the card not being read, hopefully that will be remedied shortly. Once that is done I just need to get the accelerometer into the party, we’ll see how that goes.
My hope for this project is that this new mapping will help to inform the urbanization and infrastructural improvements in the city.
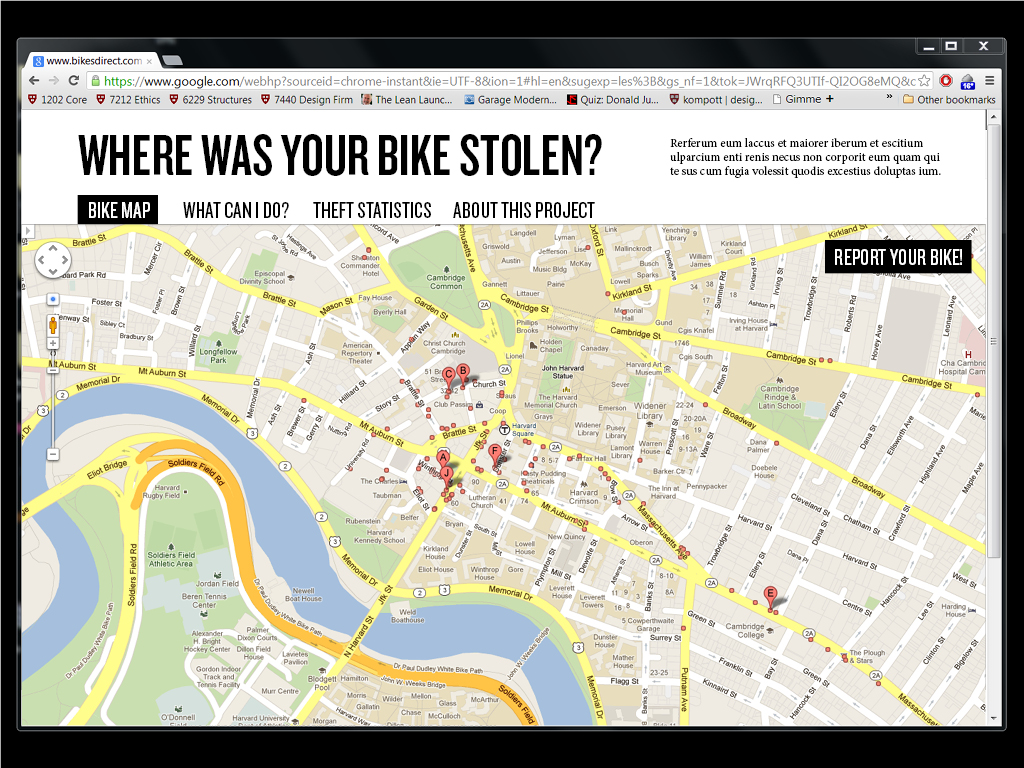
This week, I have been working on coding the bike theft map website. It is slowly coming into being. The basic layout and map functionality is completed, and the reporting mechanisms are minimally functional. I hope to complete this part of the project by this week.
In addition, I am scheduling interviews with bike theft victims to better understand the circumstances and explore other aspects of the crime that I have not yet explored. Particularly, I suspect there is a very personal narrative that exists with these events, and want to begin to collect those stories.
In the meantime, I am wondering how to reach out to bike theft victims to get the word out about the mapping tool, as well as collecting interviews. Do you know of anyone who has had their bike stolen? If so, please get in touch!
1 2 Next »