Networked Urbanism
design thinking initiatives for a better urban life
apps awareness bahrain bike climate culture Death design digital donations economy education energy extreme Extreme climate funerals georeference GSD Harvard interaction Krystelle mapping market middle east mobility Network networkedurbanism nurra nurraempathy placemaking Public public space resources Responsivedesign social social market Space time time management ucjc visitor void waste water Ziyi

GSD Harvard – Fall 2012
Master Studio carried on during the Fall semester at the Urban Planning and Design Department at Harvard Graduate School of Design (GSD). Exploring the new role of the urban designer as an activator, mediator and curator of social processes in a networked reality where citizens are active producers or prosumers.
Bostonians, through their water usage, are one part of an extensive, connected system. The delivery of water to and from your home comprises of more resources than water alone and results in large scale infrastructural interventions that shape our landscape and impacts ecosystems on both sides of the chain. Through exploring methods of communicating these concepts, I hope provide a tool that educates users as to what resources go into the treatment and transport of water, how they’re using water in their homes and why it’s important to conserve it.

“Know Your Water” came out of an interest in the hidden infrastructure of the city. Cities have complicated networks of resources that lie beneath them and only through the occasional clue, such as a manhole cover, are we even aware of their existence. Water, electricity and gas all appear at the click of a switch as if by magic; their supporting infrastructure only questioned when there are problems. I was particularly interested in the water network of Boston due to the sheer size of its supporting infrastructure. Reservoirs and aqueducts are incredibly large interventions and Boston has one of the largest man made reservoirs in the world. How have these massive landscape interventions been so successfully removed from our consciousness?
The first half of the semester was devoted to demystifying the water network, understanding all of the pieces of the potable water system from collection to use with the ultimate goal of targeting issues within the system that need to be communicated to the public. Since people tend to be very proactive about pushing for improvements in visible infrastructure such as streets, I hoped that I could help encourage them to take an equal interest in their water infrastructure and push for improvements in the aging underground networks.
Through research and interviews I realized that most of the issues in the Boston area lie not within the potable water networks, but post-use in the sewers. For example, combined sewer/storm water overflow pipes are driving the design of our sewer systems and waste water treatment plants, causing major inefficiencies in the system except during large storm events. Additionally, due to old pipes, clean water is infiltrating into the sewers which, combined with a largely impervious surface, are lowering the ground water level causing historic wood pilings in buildings. However, the most essential piece of information I found was that the knowledge gap between the user and the water system is at a very basic level. Partially due to the abundance of rain in the region, clean water is majorly undervalued and many users don’t understand why they should conserve it or even pay for it.
Currently, the average person pays only 1 to 2 cents per gallon for tap water in the Boston metropolitan area. Considering that as our population grows water is only going to get scarcer and prices cannot remain so deeply subsidized indefinitely, the goal of the project shifted to address the education of the average user towards the larger infrastructural, resource and ecological requirements of water usage.
The infrastructural requirements to provide water to the entire Boston metropolitan area are obviously quite extensive. There are three water sources feeding the system: the Quabbin Reservoir, the Wachusett Reservoir, and the Ware River. Much of the land that drains into these sources, especially the Wachusett and Quabbin, is protected and came at the cost of displacement of multiple towns. Additionally, the water travels at least 80 miles from collection to ocean release in pipes that range from 4 inches 23 feet in diameter.
There are also many other resources required in this process. A huge amount of energy is necessary to pump and treat waste water and despite many efforts to use renewable resources as often as possible by the Massachusetts Water Resources Aurthority, 84% of the energy they use is still coming from power plants. There are also several chemicals that go into the water treatment process, disinfecting and altering the water composition.
Perhaps most importantly, the understanding that our water usage is part of a larger, connected system is crucial. Our use affects ecosystems on both sides of the chain, and if the awareness of where our water will go can be achieved, then perhaps we can start to make smarter choices about our usage and what we put down the drain.
“Know Your Water” is not just about the water system alone, but is also an exercise in effectively conveying information. Much of my research is available through various water authorities’ websites but is not presented in an easily accessible format. The process of water usage is complicated and systemic; the typical diagram is not effective at communicating these types of overlapping processes. Through a reiterative method, I used animation as a tool for experimentation in communication. The resulting short animation is hopefully not just explaining the process to users, but by presenting the information in a neutral way, is asking people to have an opinion about it. Working with the water resource authorities to make this film most effective, it would ideally be provided to users at the point of payment online. This animation is only the basic information, leaving many opportunities for the more specific sewer issues to be addressed in accompanying videos.
Our lives are filled with choices. From the rare and complicated to the mundane, we venture through life moving from decision to the next. Often we take our time to consider our options, choosing the path that provides maximum utility; however, many of our decisions are made with little thought to cost or consequence. When taken alone these decisions can be overlooked, but if these decisions reveal a pattern across a community they magnify into material harm. Trashy Behavior is a project determined to shift trash choices toward more sustainable solutions and improve our world, a community at a time.
When I began this project, I was interested in investigating these individual decisions that create a network of consequence in our cities. By bringing together urban planning and design with the field of Behavior Science I believed I could identify a specific moment of individual choice that is replicated often enough that any shift in behavior could have a material impact. With the guidance of two behavioral scientists, Todd Rogers and Erin Frey, I began considering moments such as commuting choice, shopping behavior and digital mapping; however a daily interaction with a public display of bad design took me in an unexpected path.
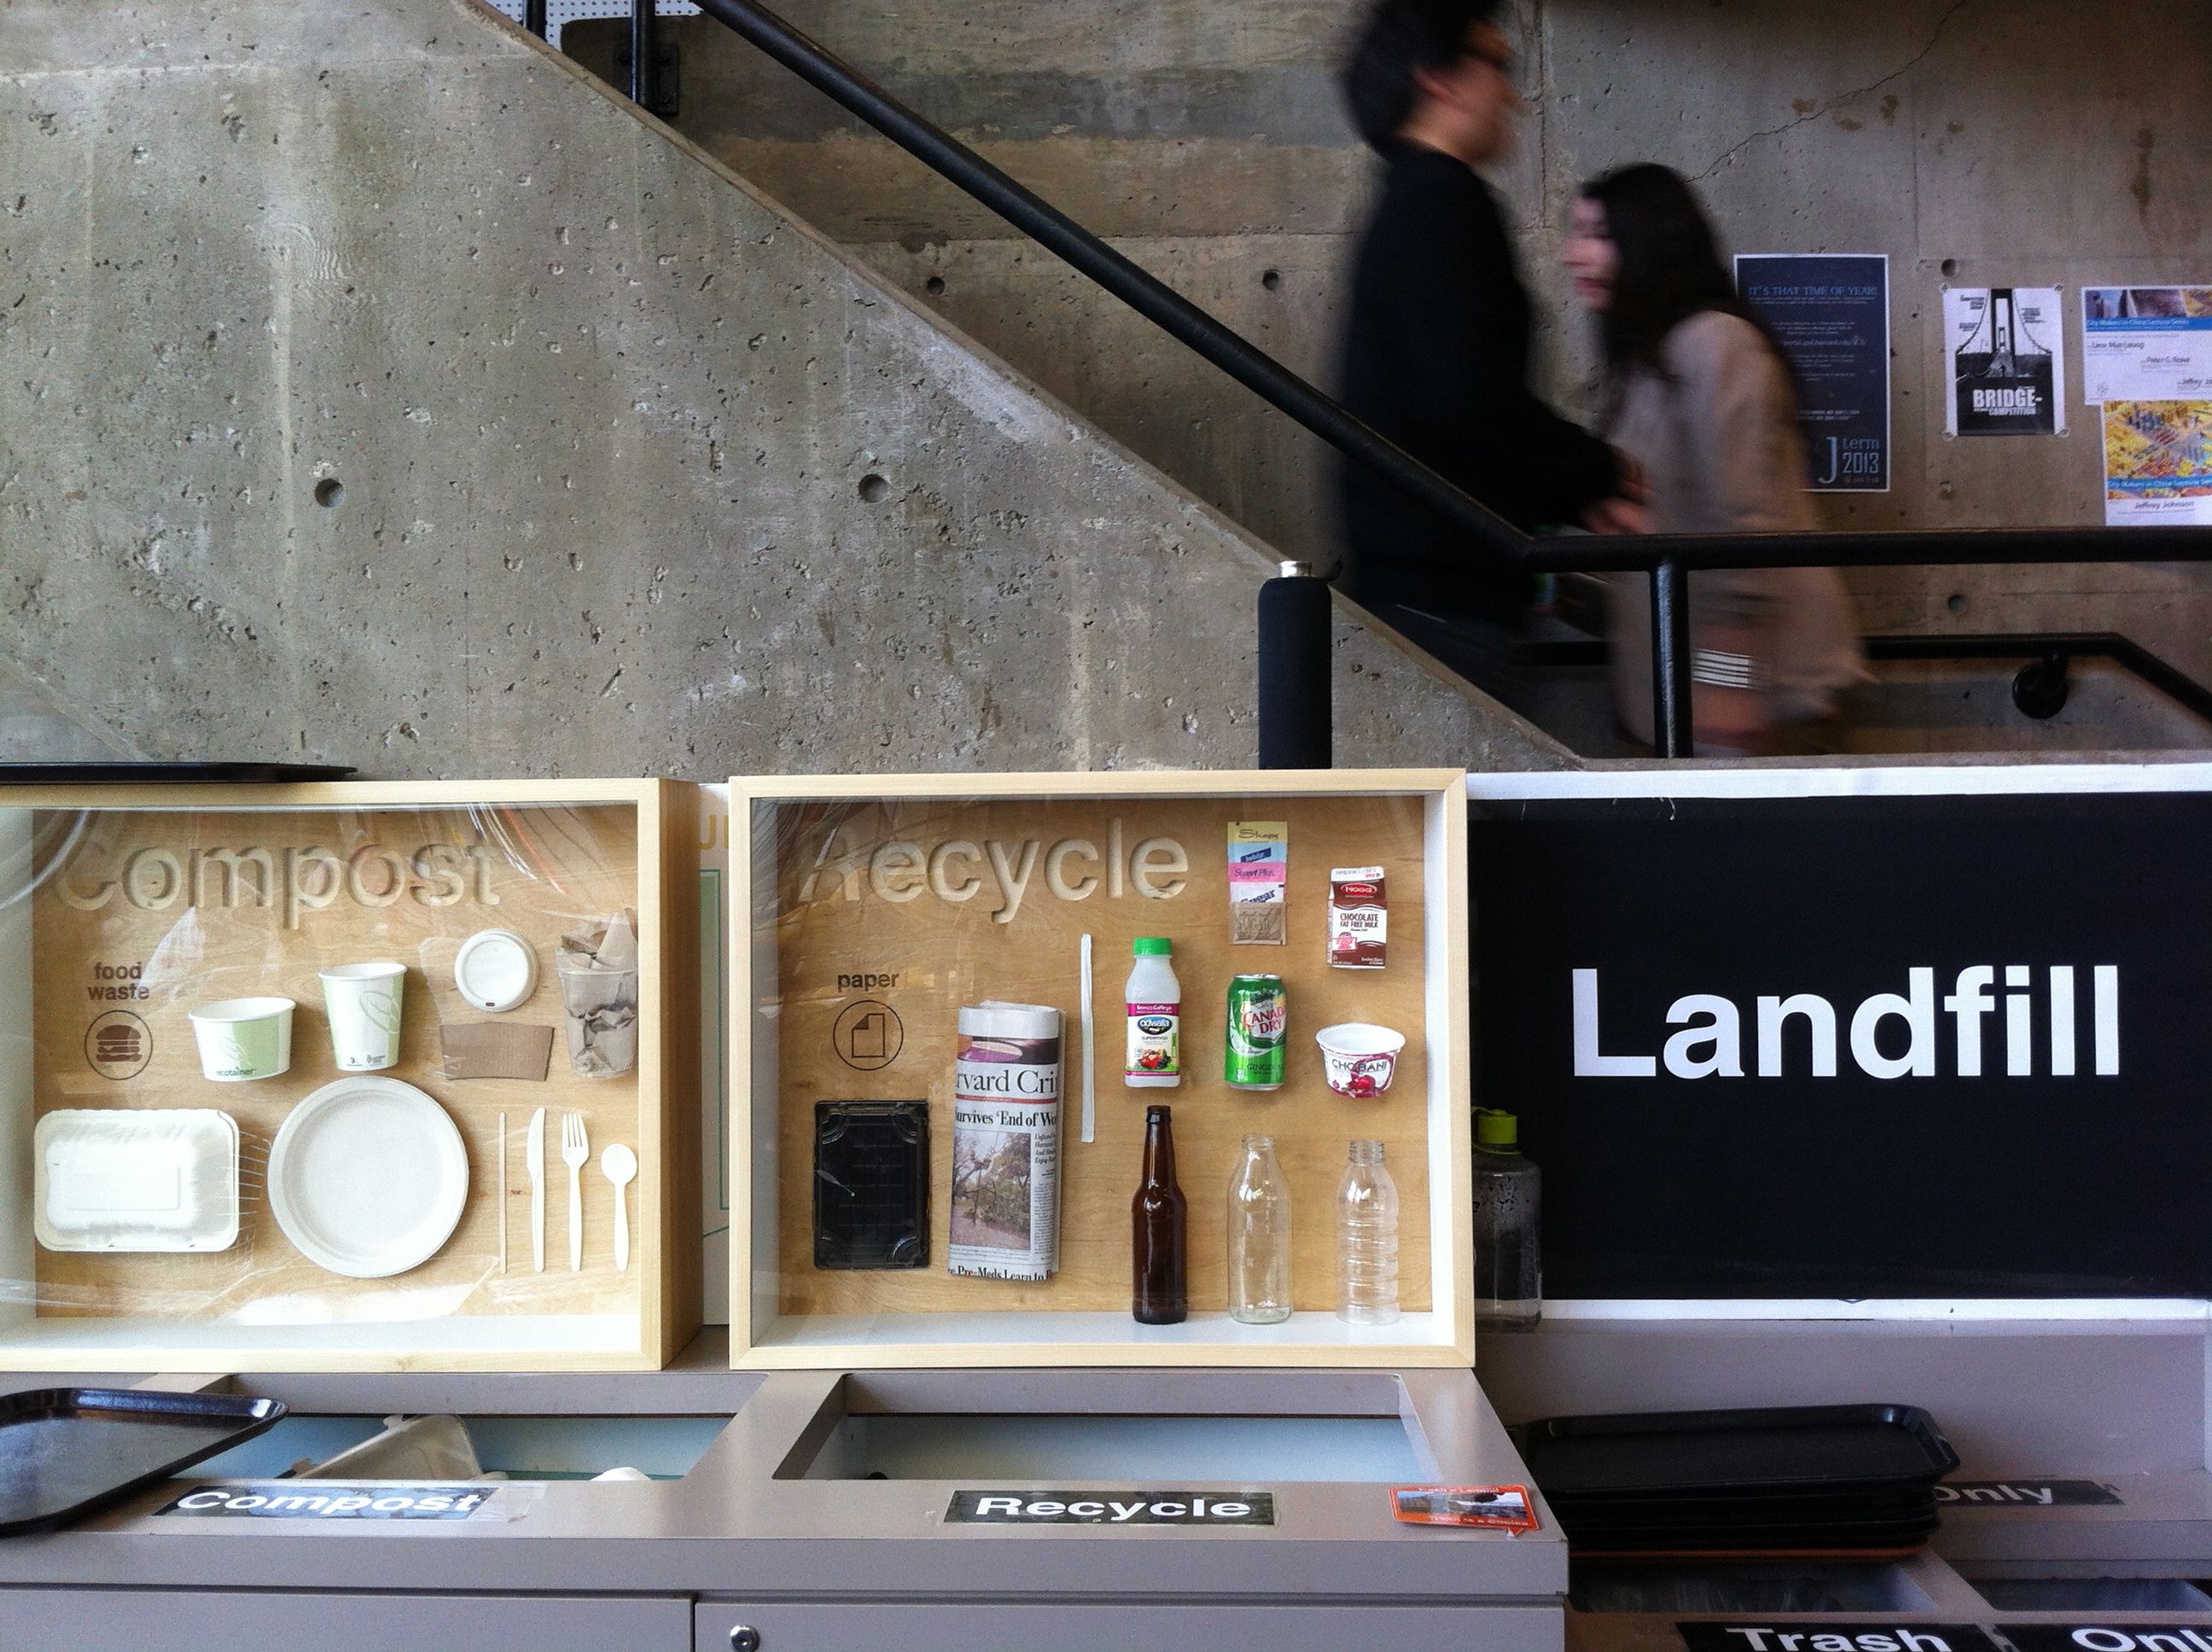
In Chauhaus, our cafeteria at the GSD, I noticed how difficult it was to decide where to throw my trash. The large, public trash station seemed designed with proper sorting in mind, but had little understanding of behavior. The signage was a confusing mess of small images including both what does and does not go in each bin. Conversations with my peers confirmed that I wasn’t alone in my confusion, so I decided to observe the pattern for scientifically. After indiscreetly filming the trash station during several lunch rushes, I was not surprised to see person after person showing signs of confusion. A 2010 waste audit at the GSD confirmed my suspicion that when people are confused, they default to the easiest option, the trash bin. Here was my opportunity to test my theory that relatively small interventions could scale across a community for noticeable change.
Knowing little about waste I sought out the expertise of Robert Gogan, the director of Recycling and Waste Services at Harvard as well as Trevor O’Brien, GSD Building Services at member of the Harvard Green Team. Realizing that I could not intervene without a personal understanding of my own habits, I created a commitment device known as Trashless Tuesdays. Similar to Meatless Mondays, my goal was to stop producing trash at least one day a week, a 15% reduction in my own waste footprint. I then created a plan for intervention and scheduled a new waste audit to test our results. The most obvious intervention was to redesign the trash station at Chauhaus. I did this by simplifying the display to show only what went in the Recycle and Compost bins and attaching the negative association of the giant word “Landfill” to the trash bin. However, I also knew that a significant amount of trash was improperly disposed of in the rest of the building, away from the Chauhaus trash station. To shift this behavior I decided on a public awareness campaign of stickers placed in conspicuous locations around the GSD. Using behavioral techniques such as anchoring, social norms, and self-perception theory these stickers were intended to prompt conversation and awareness. Each of the stickers included the message “Trash is a Choice” along with the twitter hash tag, #trashlesstuesdays, in the hope that this might translate into a digital conversation as well.
The week of rollout I recorded the lunch rush at the Chauhaus station and saw a more efficient use of the station. I also scheduled conducted a waste audit in the Pit at the GSD. This very public display of our trash was met with conversation and even outright consternation. Despite this being the trash produced by our community in the GSD, this was now a “biohazard”. The audit served its purpose as public shaming and performance art as crowds stood around watching their peers dressed like lab technicians dig through and resort their trash. The interventions were successful in producing a material behavior change, as we saw a 40% increase in composting accuracy and a 140% increase in recycling accuracy!
It is certainly a success to have this kind of behavior change in a controlled environment, but how can we impact trashy behavior more universally. One option I have begun to consider looks at the 100 million tons of building and construction materials we throw in landfills every year. Taking a cue from the shadow boxes at Chauhaus, what if we knew what was in every building and whether it was recyclable or reusable before demolition? How could this impact the behavior of the development and building trades? Could we create a more efficient market for these products and shift global behavior away from disposable materials to reuse? I don’t know the answers yet, but my experience this semester gives me reason to hope that with simple interventions our behavior doesn’t have to be so trashy.
Today’s highly connected world has enabled new forms of communication that have heretofore been impossible. Platforms such as Facebook, Twitter, and Quora allow us to connect with our friends, followers, or people of shared interest, essentially without regard for their physical location. These new forms of interaction are invaluable in their ability to target a very specific audience in ways that are difficult or impossible without current technologies. But while these technologies have largely erased spatial barriers, its potential for facilitating proximal interactions has been left largely unexplored.
What if there was a platform where we could easily share photos and have discussions with fellow event-goers with whom we share our current location? What if this platform could let us talk to our neighbors about community news, ask about a lost pet, or put an item up for sale? What if this platform could allow a new tenant to ask existing residents about move-in advice?
Despite the tremendous value in locally-targeted communication, there is as yet no dominant platform through which to do so. Services that connect you with your residential neighborhood do not allow you to engage with people outside of its boundaries. Services that let people to post in predefined public places do not reflect the users’ sense of place. Services that allow people to post geolocated messages via their physical location do not capitalize on the inherent advantages of the digital medium to transcend spatial restrictions.
For these reasons we decided to develop our own solution:
![]()
Hear Here is a location-based discussion board that allows people to connect with each other through the commonality of place. It allows users to engage in threaded discussions that are linked to locations around them. Nearby discussion threads are displayed based on the user’s physical location. Users can also view discussions in other places by moving their virtual selves to that location. These discussions are persistent—they can be viewed and continued by future users even after the original participants have left. Hear Here is designed to foster both local community and provide an avenue for transient populations to engage with locals and with each other.
Hear Here is entirely user generated. Its users create both the content and the geometry of the places to which these topics are tagged. These places can range in scale from a single building up to a city district. A place can be as well-defined as a building or as nebulous and transient such as an impromptu street festival. And because these places not defined by top-down categorizations, Hear Here can provide insights into how people truly conceive of place.
Hear Here can be understood as a conciliation of the digital layer with the physical world. Discussions, conversations, and thoughts are mapped to a virtual representation of real space. Hear Here is still cyberspace—you are free to move your virtual location wherever you want—but it straddles the digital/physical divide in a way that marries the qualities of both kinds of space. It liberates real world users from physical restrictions by allowing them to engage with others at any place and any time, yet it still retains the real world spatiality that is valuable for targeting users. This spatial duality is still a novel and under-explored conception, but we are excited to see how people utilize it in ways we cannot yet imagine.
Introduction
With the fiscal challenges and complicated regulatory processes that characterize many American cities today, communities often struggle to fully utilize the potential of public spaces to stimulate social and economic activity. This project focused on developing new strategies for activating urban public spaces by applying the existing talents and resources in the city to create temporary interventions that foster community and activity. Several interventions were part of the experiment, ending with an ephemeral intervention that mobilized the existing resources and talents to transform a space that is often underused and closed to the public into a public space for the wider Cambridge community.
Background
Many American cities today are grappling with the role, control, funding, and use of public spaces in their urban communities. Frequently, American cities face immense fiscal difficulties as municipal budgets are stretched thinly to cover the large expenses of many departments, services, and programs. Given the many demands in the municipal operating and capital budgets, it can be difficult for cities to prioritize maintaining and programming public spaces. As a result, communities may not derive the social, economic, and health benefits that activated and well-used public spaces can provide for urban societies. The servicing and programming of public spaces could be provided by non-governmental organizations and individuals, but public spaces are often operated under tight regulations and bureaucratic processes that can make it challenging for non-governmental organizations, programs, and services to use the public space for the benefit of the community. Unfortunately, these funding and regulatory issues create a challenging situation for American cities: urban communities may not be maximizing the returns of the important services and benefits that well-used, active public spaces can provide for individuals, neighborhoods, businesses, and government entities.
Process
As a student in the Master in Urban Planning program at the Graduate School of Design, Melissa Jones has been studying these issues surrounding public space in American cities today and she focused her studio work in “Networked Urbanism” on this topic. Recognizing that the complexity of these problems, Melissa’s work this semester focused on a series of experiments to test out strategies for activating public spaces. Her efforts aimed to create ephemeral interventions that activated urban spaces in novel ways and fostered interactions between community members.
 Park(ing) Day
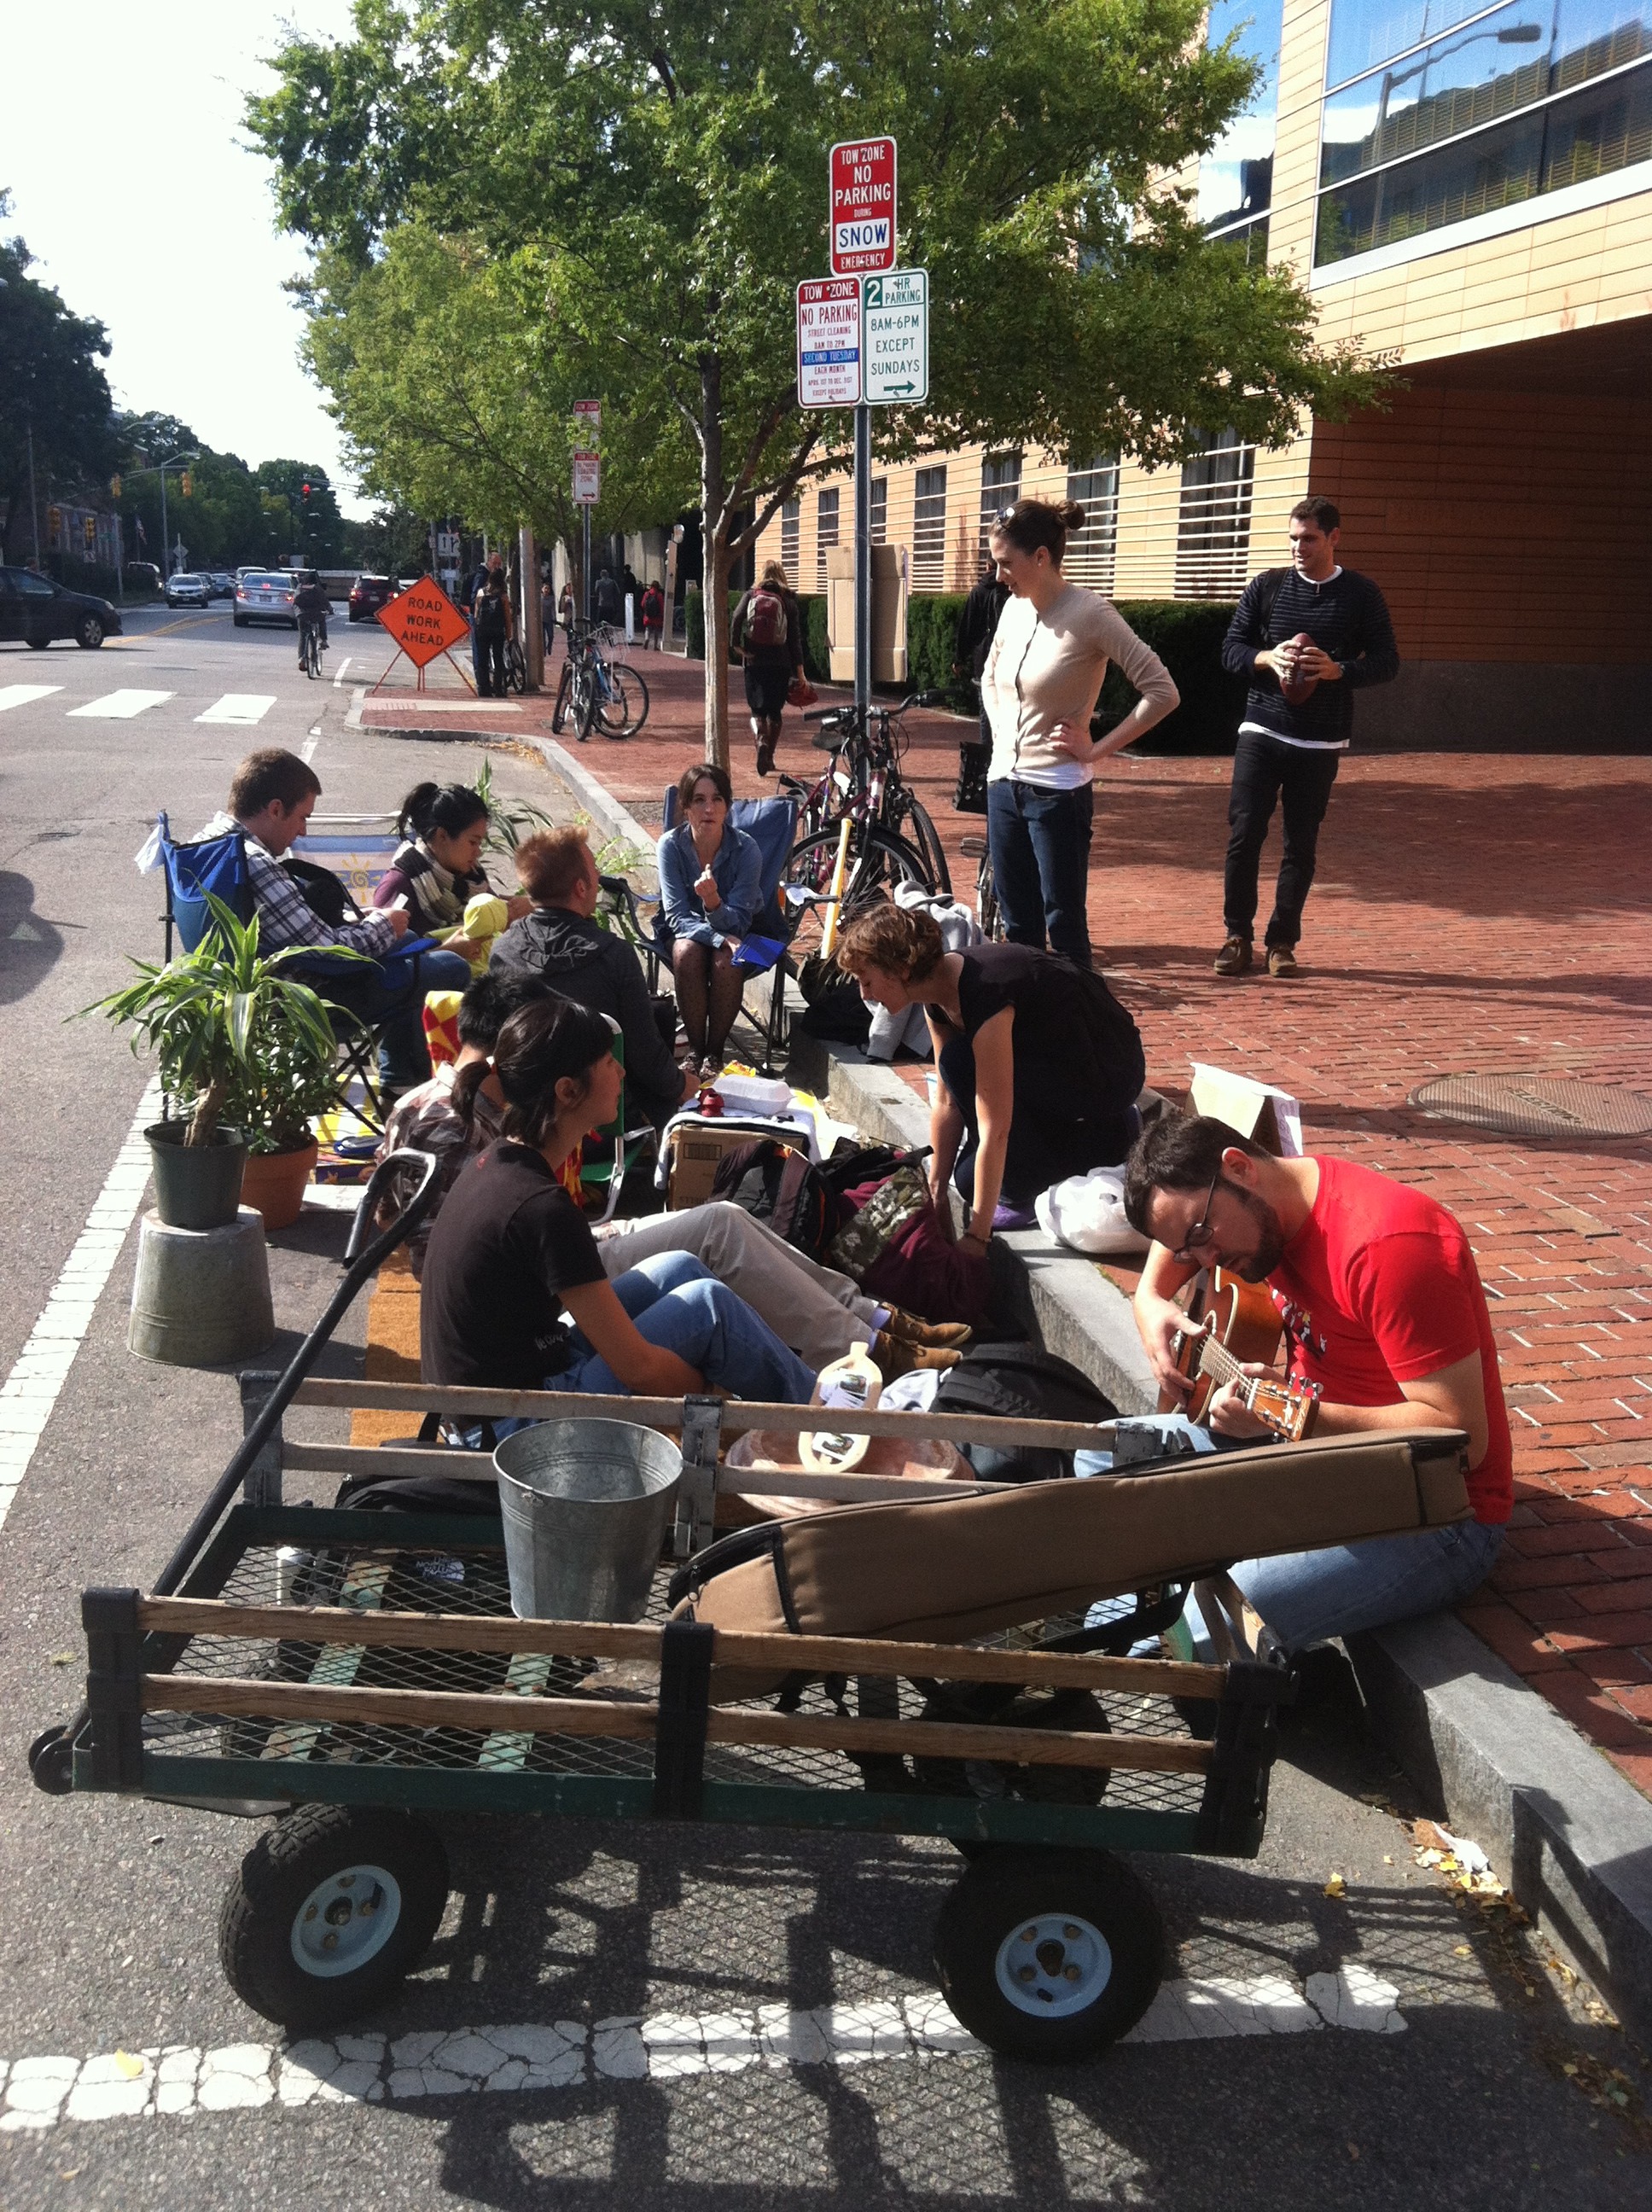
Melissa’s first intervention was for Park(ing) Day in Cambridge on September 21, 2012. Park(ing) Day is an international event that was started in San Francisco by Rebar, an urban design and activism group, to challenge the conventional uses of urban street space. Street parking spaces normally occupied by parked cars are converted into small parks for one day. Melissa worked with the City of Cambridge to get the necessary permits and the Harvard Urban Planning Organization to create the Graduate School of Design’s park. It was located on Cambridge Street near the GSD, and local businesses loaned plants and matted flooring materials to make the parking space into a softer and more inviting place for people. The free ice cream offered to passersby helped draw them into the park. Students, residents, and employees from the area stopped by to hang out in the park, and Park(ing) Day succeeded in activating a public space in a new way and encouraging community interaction in the public realm.
Melissa’s second project focused on new strategies for activating the Cambridge Common for families. When she took her plans to the City, however, she learned that receiving the necessary permits and approvals for temporary interventions and events in Cambridge public spaces can take up to six months. Rather than focus on an intervention several months out, Melissa decided to set aside the plans for the second project and focus on a different intervention that could be completed within the semester. Switching strategies, she approached the Harvard Common Spaces Program, which aims to activate public space on campus to foster community interactions. Melissa talked with Program staff, and learned that they had great success by anchoring ephemeral interventions to more capital-intensive, physical interventions, like seating, tables, fire pits, and an ice rink. However, as they did not have strong anchor programs in place during November through January because of weather challenges, another approach would be necessary. Nonetheless, it was very inspiring to find a formal university program that worked to address the issue of public space activation and fostering community on campus, which would serve as a template for Melissa’s own interventions.
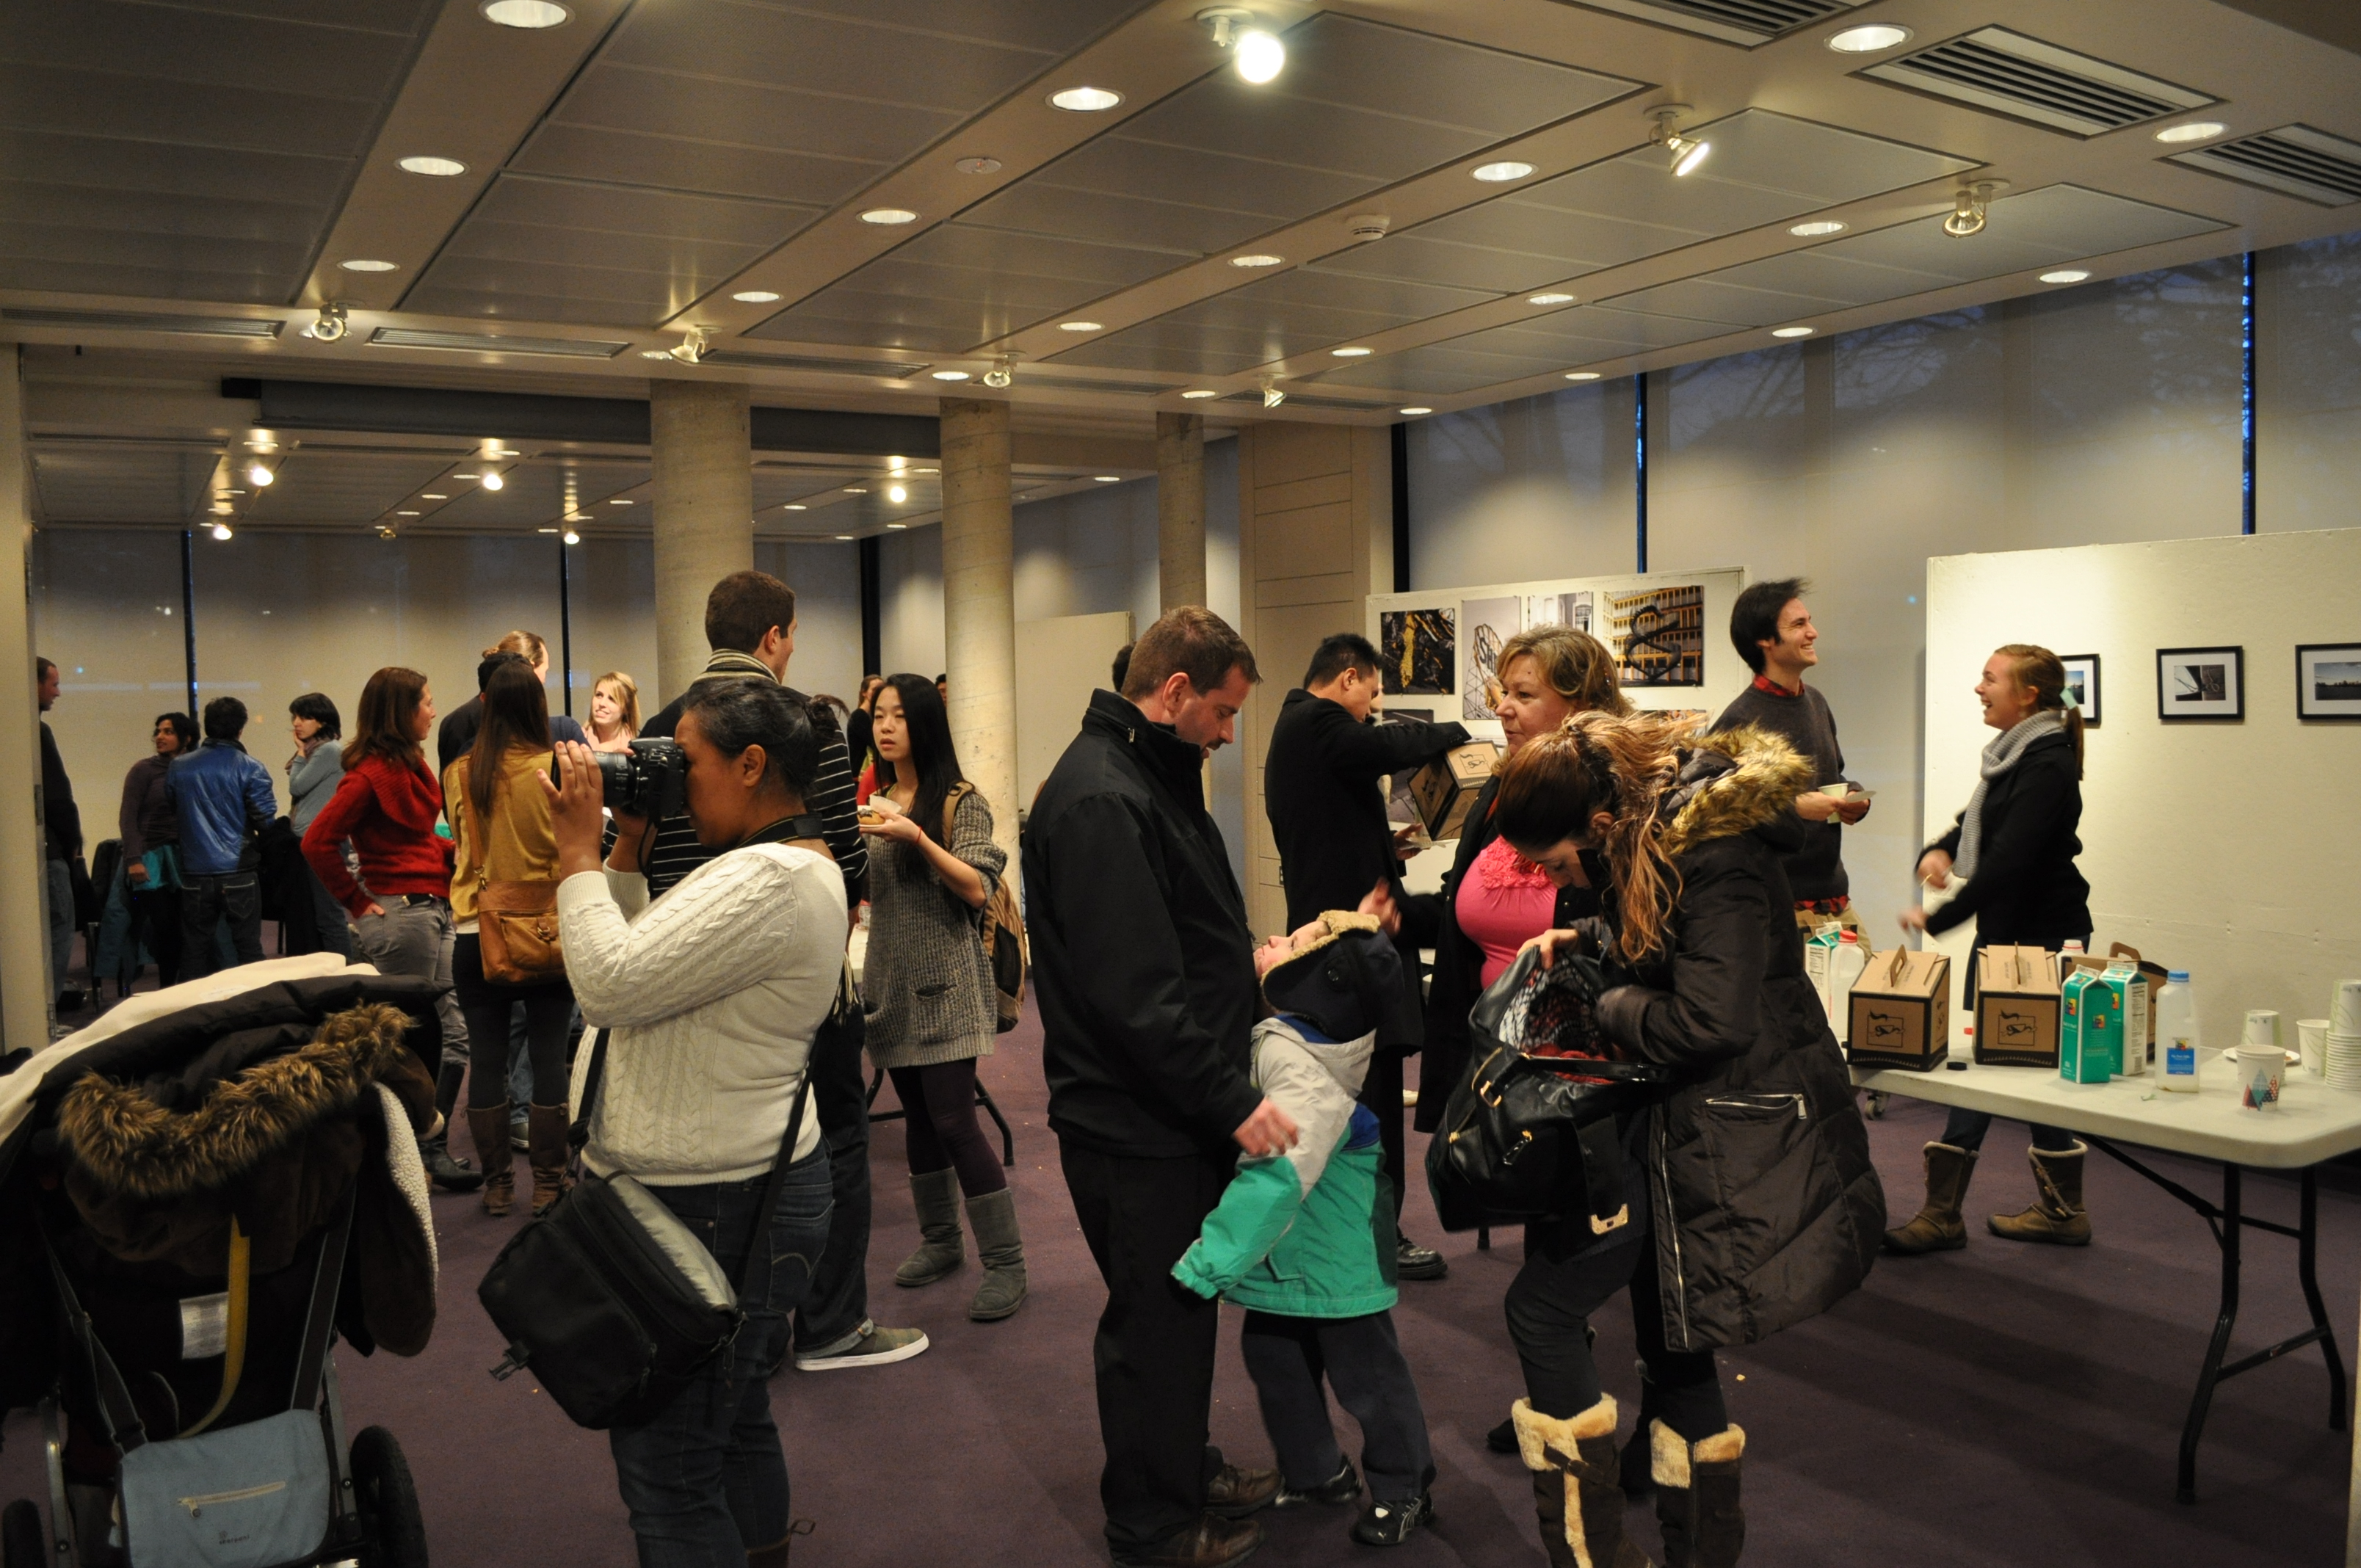
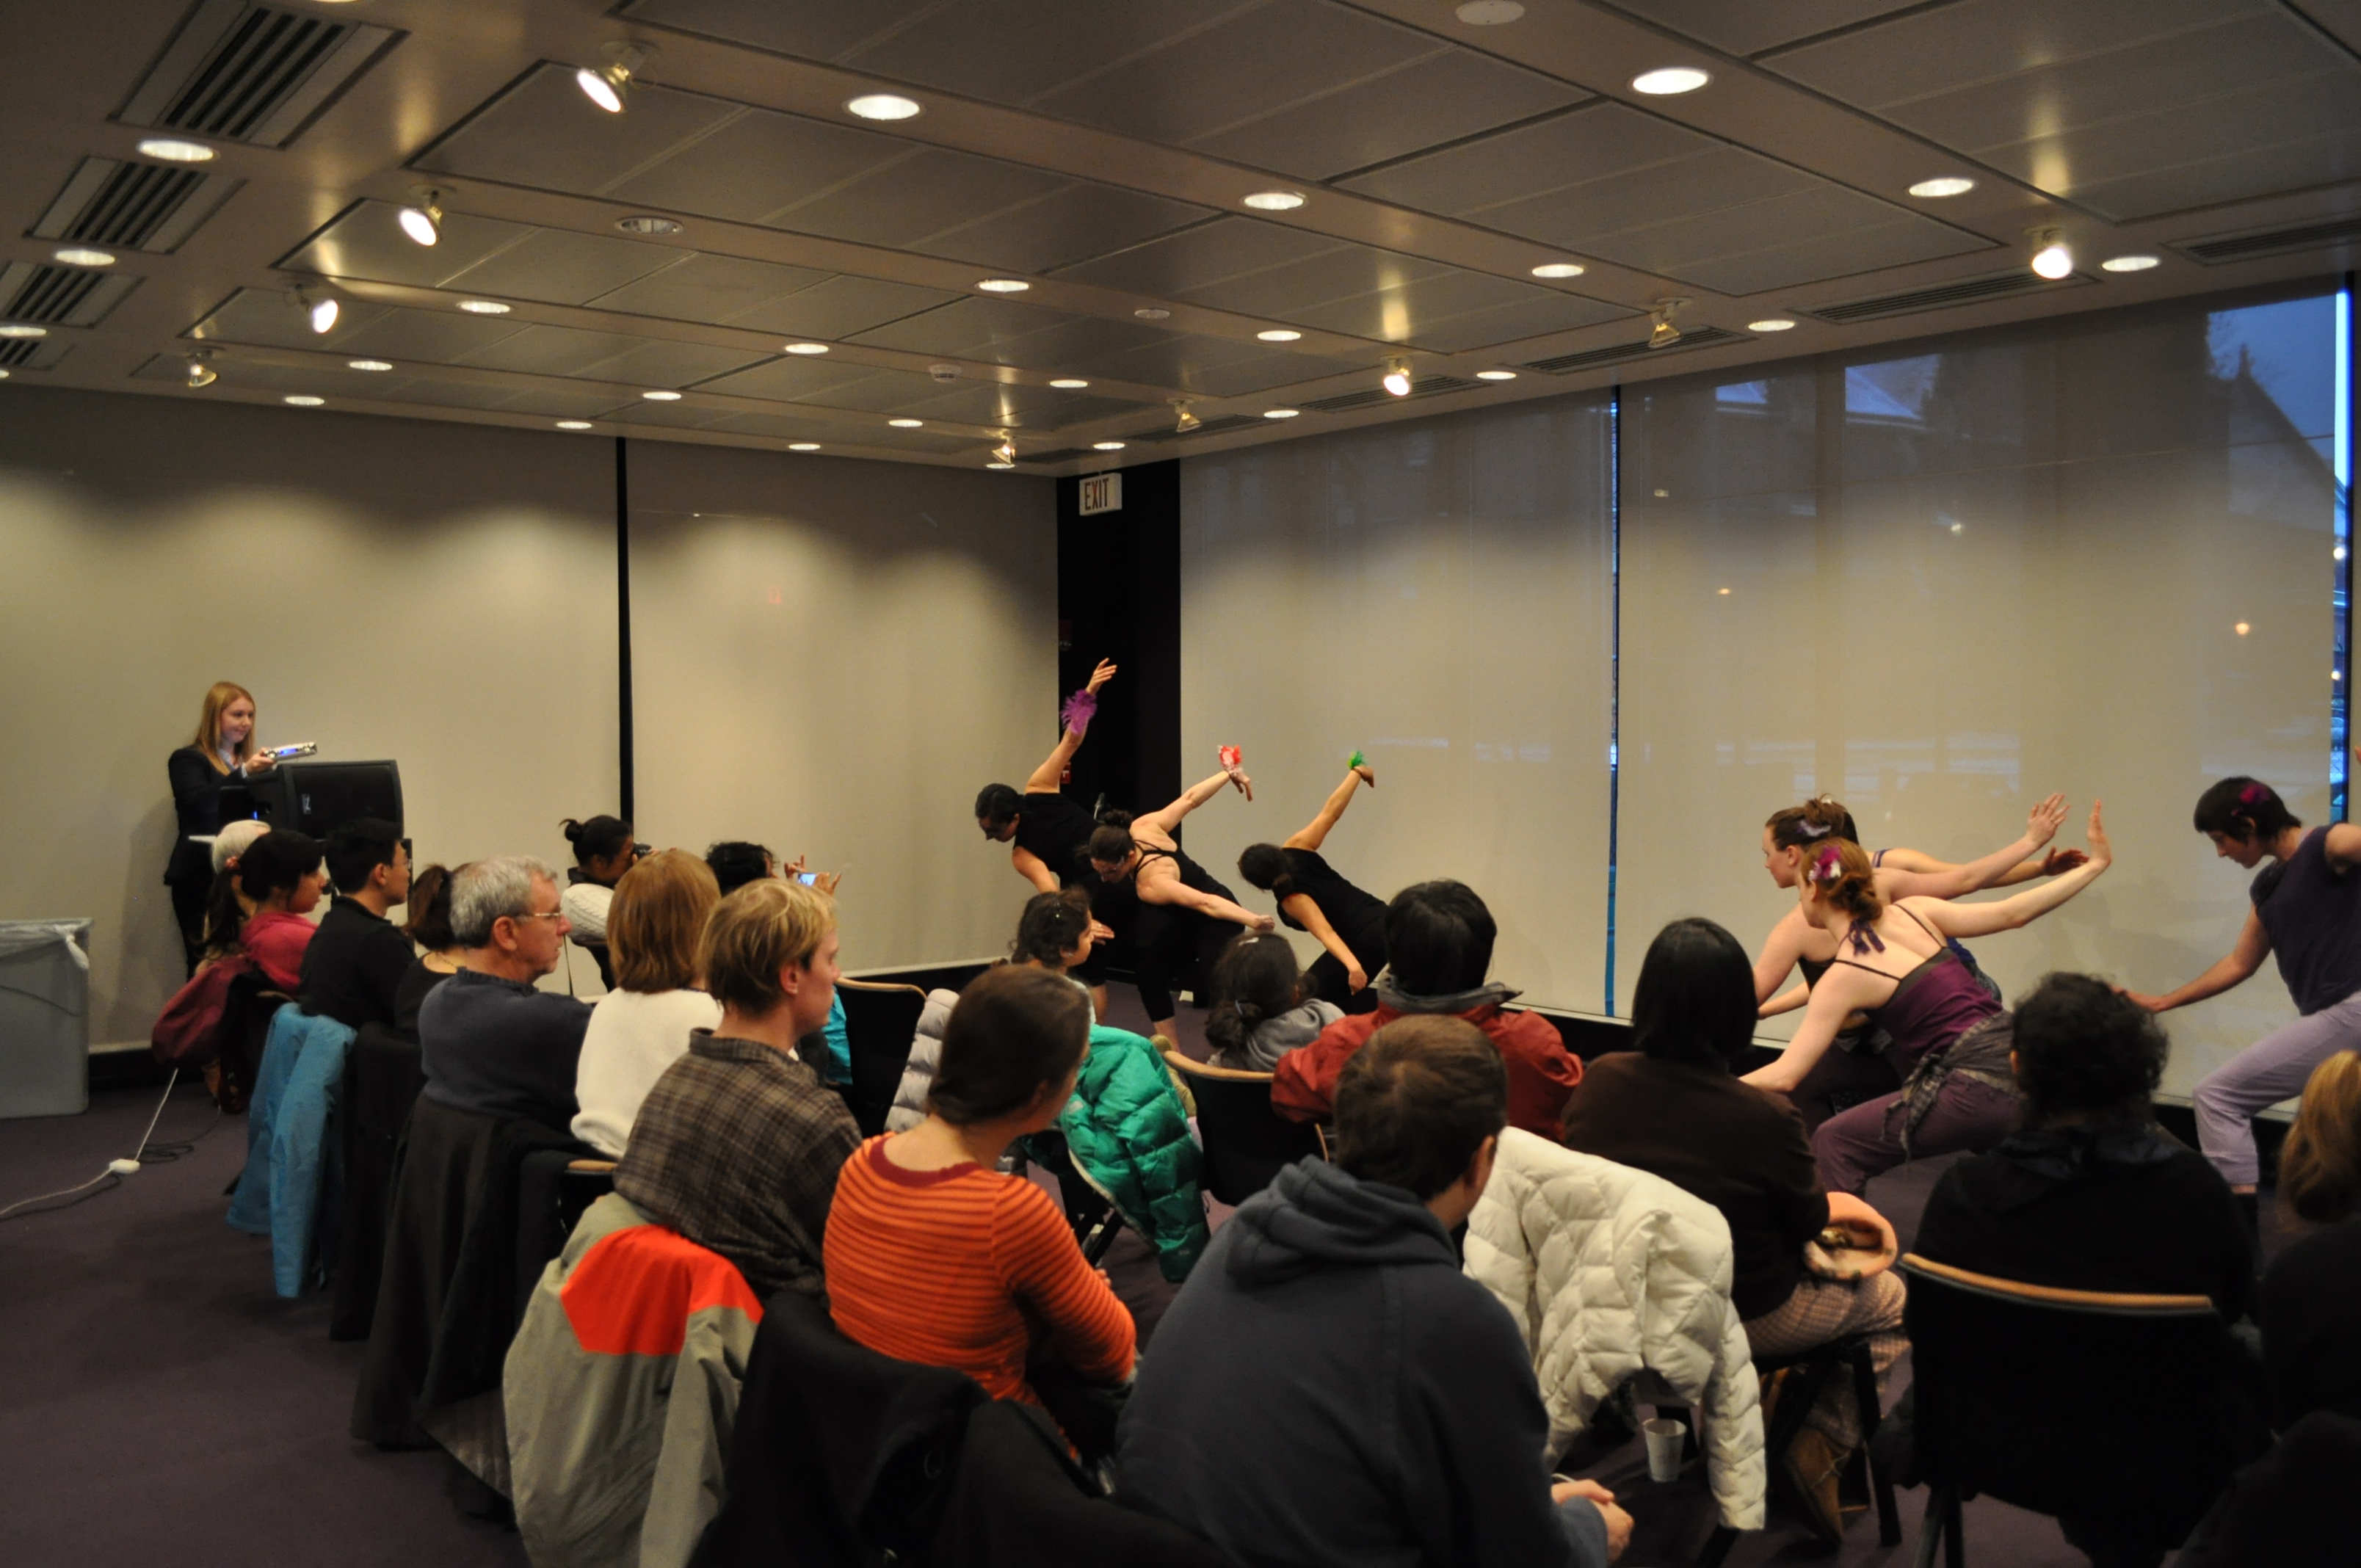
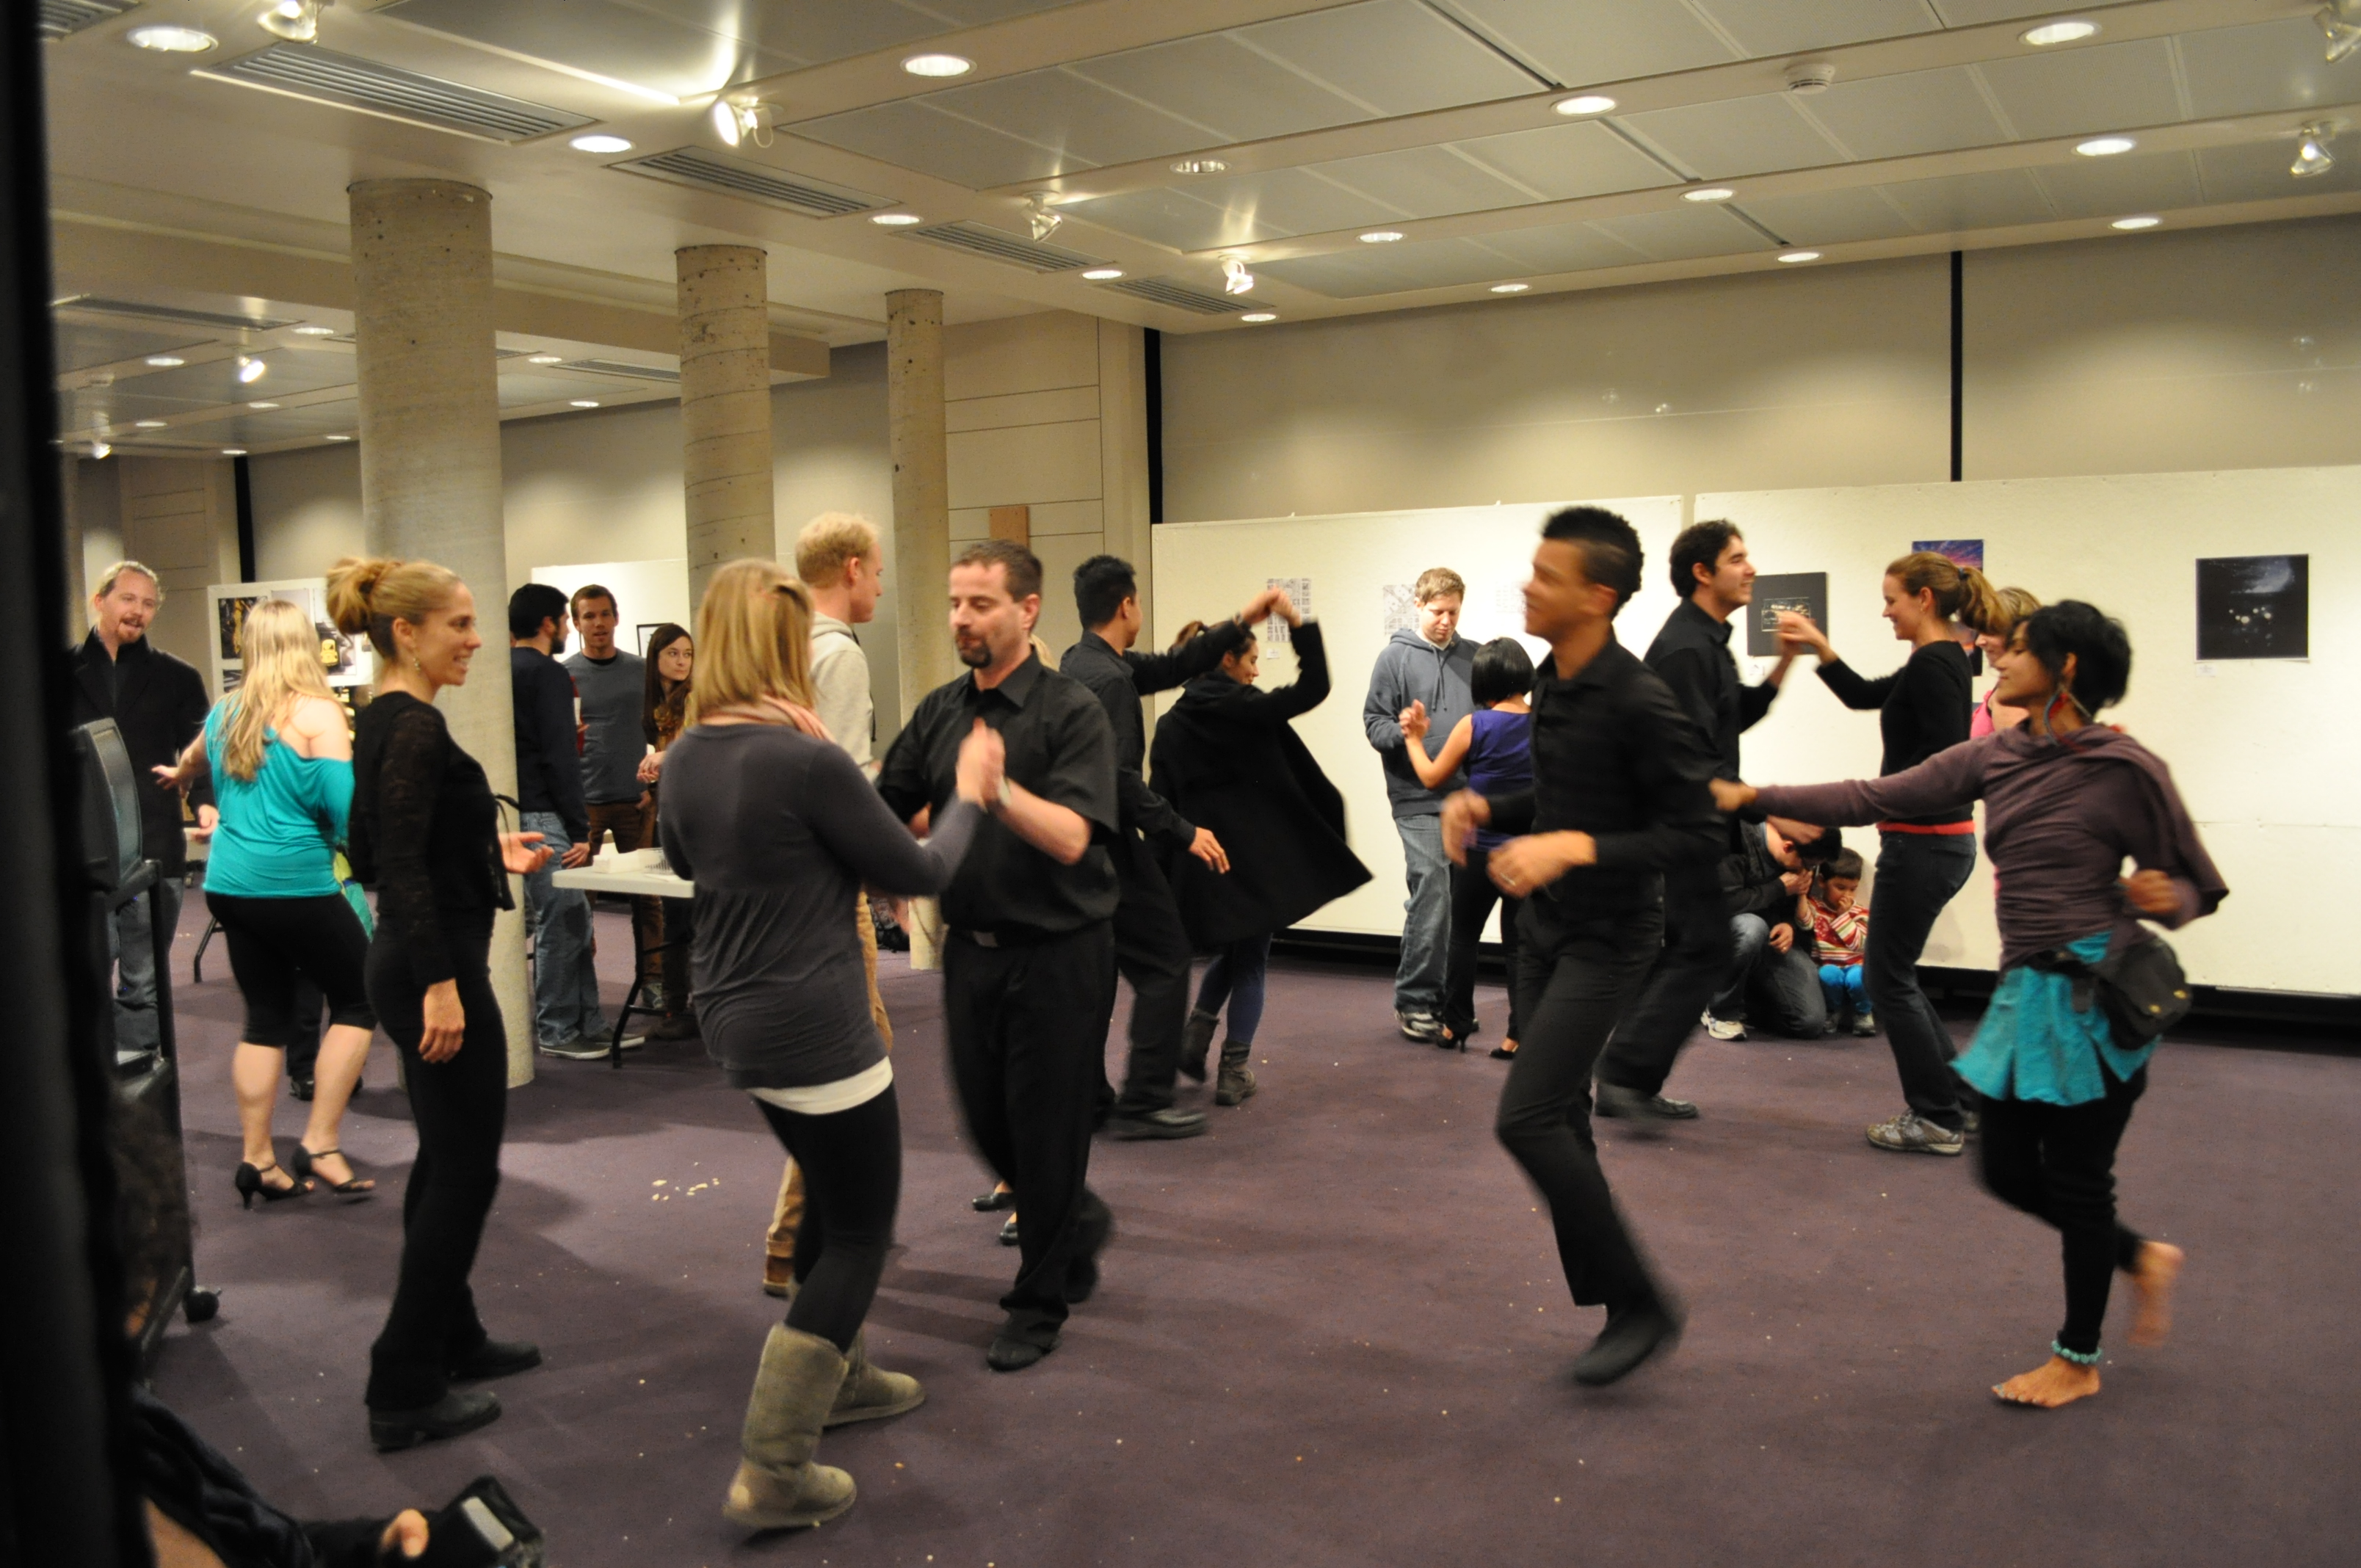
In strategizing with Loeb Fellow and Lowell Cultural Planner LZ Nunn, Melissa developed a plan for a last intervention: to mobilize the existing resources and talents in the Cambridge and Harvard arts communities and encourage more interaction between Harvard students and Cambridge residents. The ephemeral intervention would take place on Harvard campus to activate an underused space and turn it into an active public space for an afternoon. She reached out to many community arts groups across Cambridge and Harvard and received enthusiastic responses from many dance performance groups who liked the idea of bringing diverse communities together in a new space through the arts. Melissa also received many positive responses from local visual artists who were interested in contributing works to an art gallery. Mobilizing the visual artists and dance performers to come together in a new space for an afternoon resulted in Decemberfest, an ephemeral intervention to activate the frequently closed GSD porticos with public community interactions. Sponsored by the Harvard Urban Planning Organization and supported by the Urban Planning and Design department, Decemberfest was a great success. It brought together sixty to seventy people from diverse communities, including MIT, Harvard GSD, Harvard Kennedy School, and the wider Cambridge community, breaking down the divide between the student and resident populations for the afternoon. The salsa lesson at Decemberfest was particularly successful in encouraging the direct interaction of the diverse individuals. The project succeeded in transforming an underused, private space into a public space for the afternoon through the arts and resulted in wider community interactions that the intervention had aimed to promote.
Conclusion
Ultimately, through “Networked Urbanism,” Melissa experimented with different strategies for activating urban spaces in Cambridge. Despite the regulatory roadblocks and bureaucratic difficulties that she ran into, two of the experimental interventions proved successful in changing the way urban spaces were used, challenging the conventional and traditional uses and roles those spaces played in society. The projects brought together diverse individuals from communities across Harvard and Cambridge, promoting more interactions between the student and resident population and addressing the social aspects of the “town and gown” issue in this area of the city. She had great success with coordinating and mobilizing a community’s existing resources and talents towards activating public spaces and providing new uses of urban spaces. These projects can serve as a blueprint to be employed by cities to capitalize on their existing resources and networks to ensure that public spaces are utilized to their full potential, increasing the vitality of the wider community.
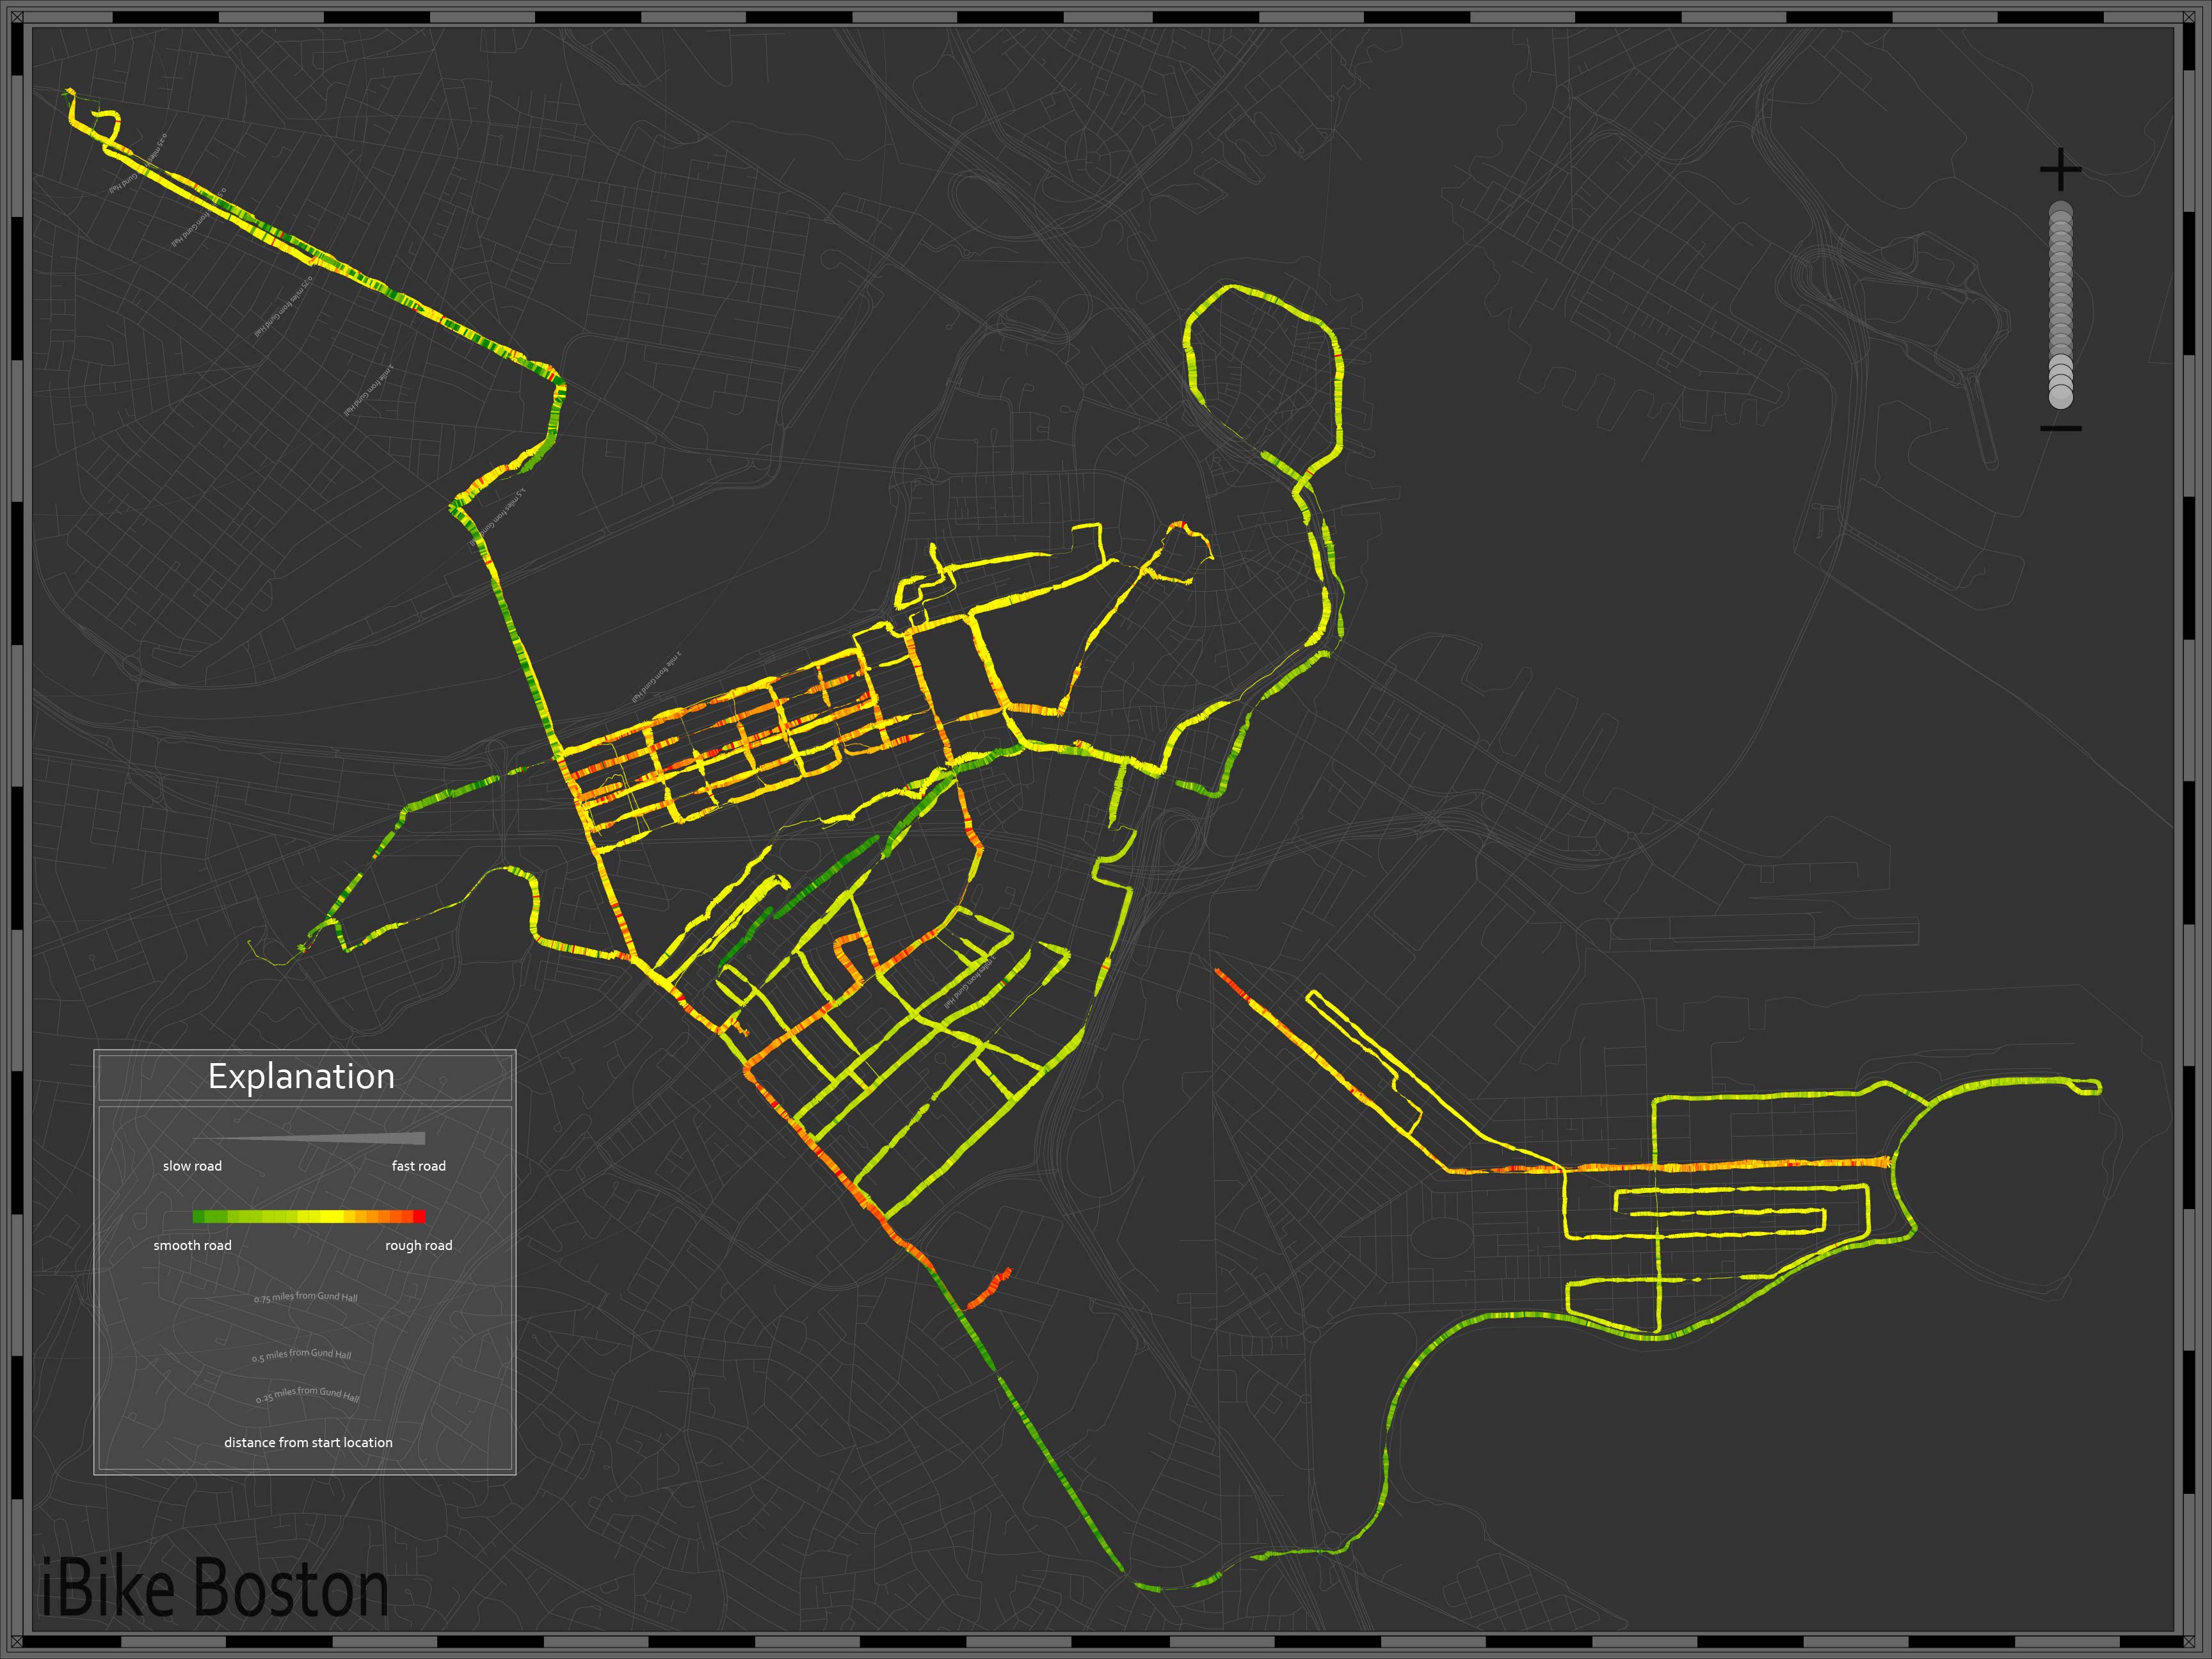
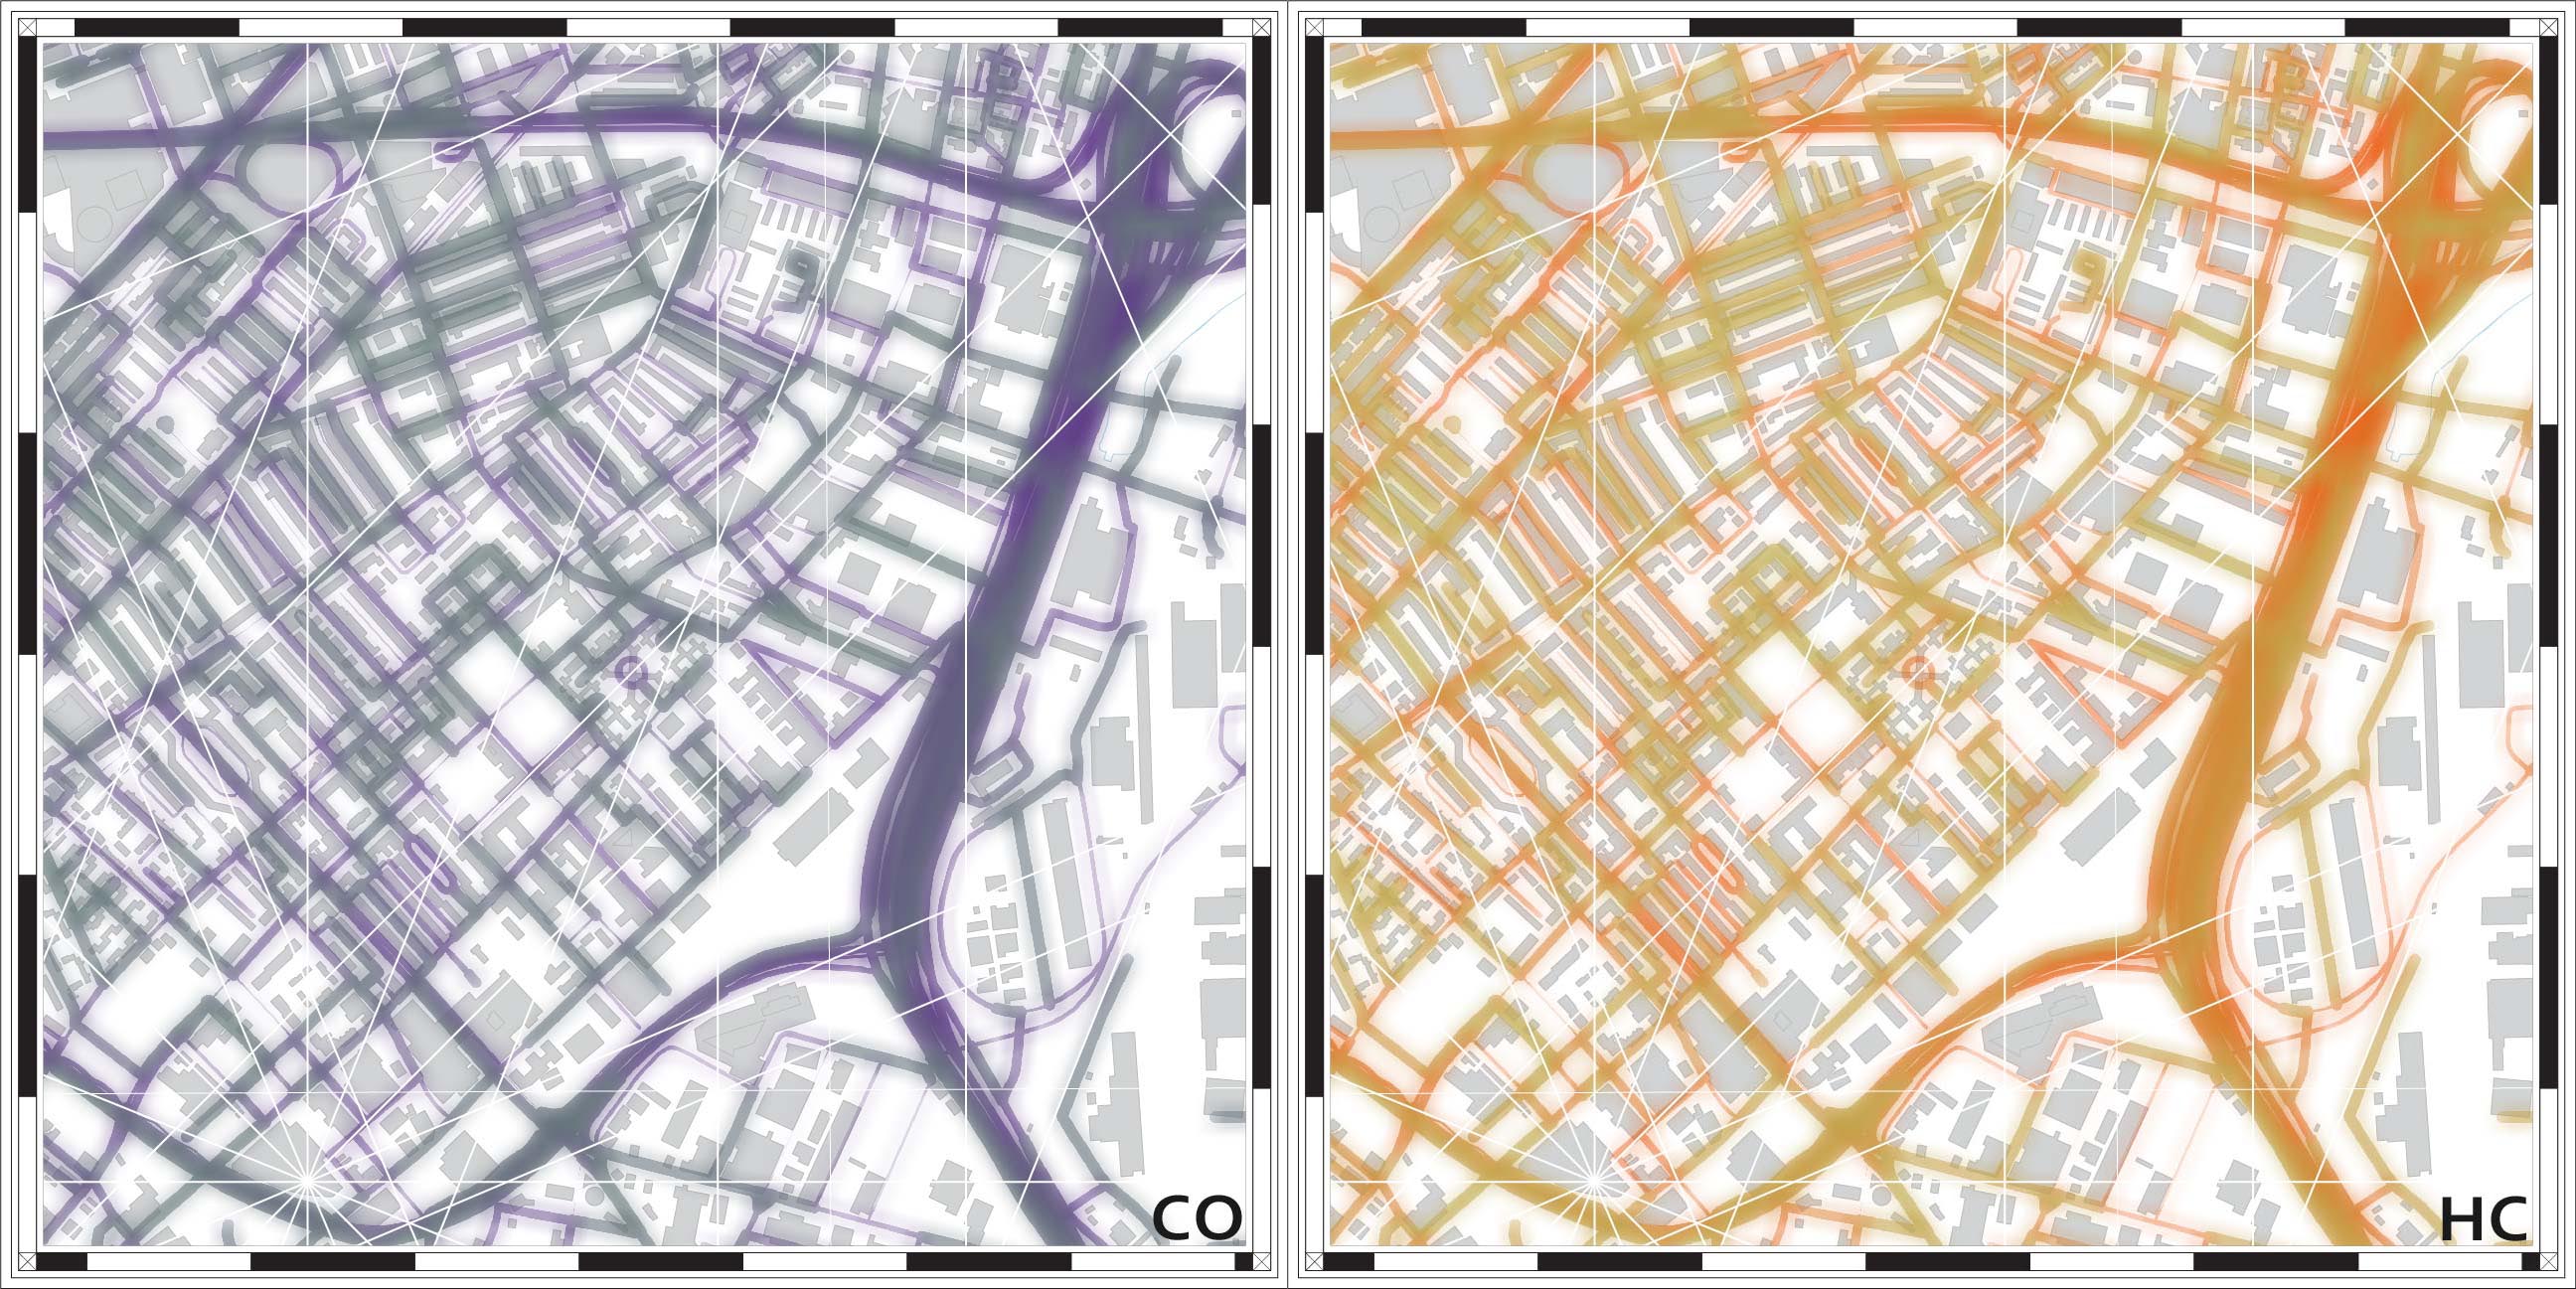
iBike, questions both the data collection as well as the dissemination. By mounting specific sensors to a bicycle data was collected in an effort to draw the experience of cycling in Boston. Using an accelerometer to measure micro-topography and a GPS to geo-locate the information and to provide speed data, I am questioning the existing maps by redrawing the city based on the experience of cycling. The width of roads is drawn based on the speed of travel (faster roads feel wider) and the micro-topography is drawn by increased density of marks when viewed at the neighborhood scale and as a color gradation at the larger scale. The resulting maps provide the cyclist with a layer of information absent in existing cycle maps that relates directly to the human experience.
iBike Boston began with a simple proposition, go out and explore Boston, discover the city. This seemed a funny proposition as Boston is my home, where I have lived and worked for eight years, having grown up in a smaller city fifteen minute to the south. Accepting the challenge of discovering my city I decided to take my bike and ride around the residential part of South Boston. I have spent quite a bit of time in Southie, but always along the water or along Broadway, the main street running through the middle. What I found was that it was nearly impossible to get from my appartment in the South End to South Boston, a distance of only about two miles. Though Boston has been making great moves to become a more cyclable city, there exist still major gaps in the infrastructure and linkages. The two mile ride to Southie bring you across a four lane intersection and on ramp over the highway and around a major rotary, the way back sends you under the highway where no cross lanes exist.
This adventure got me thinking about how different the rhetoric about Boston being a more cyclable city is from the actual experience of riding. I began looking at maps, both cycle specific as well as common digital maps. The cycle maps that if found provided little information on what the surficial conditions actually were. Cycle lanes, when represented at all, were color coded lines drawn over centerline of streets, simply denoting that a cycle lane exists with no hint at the quality or width of the lane, just a demarcation of it’s existence. The base maps that the diagrammatic overlays were applied to are similarly simplified, seemingly dependent on satellite imagery to provide any “real” surficial information.
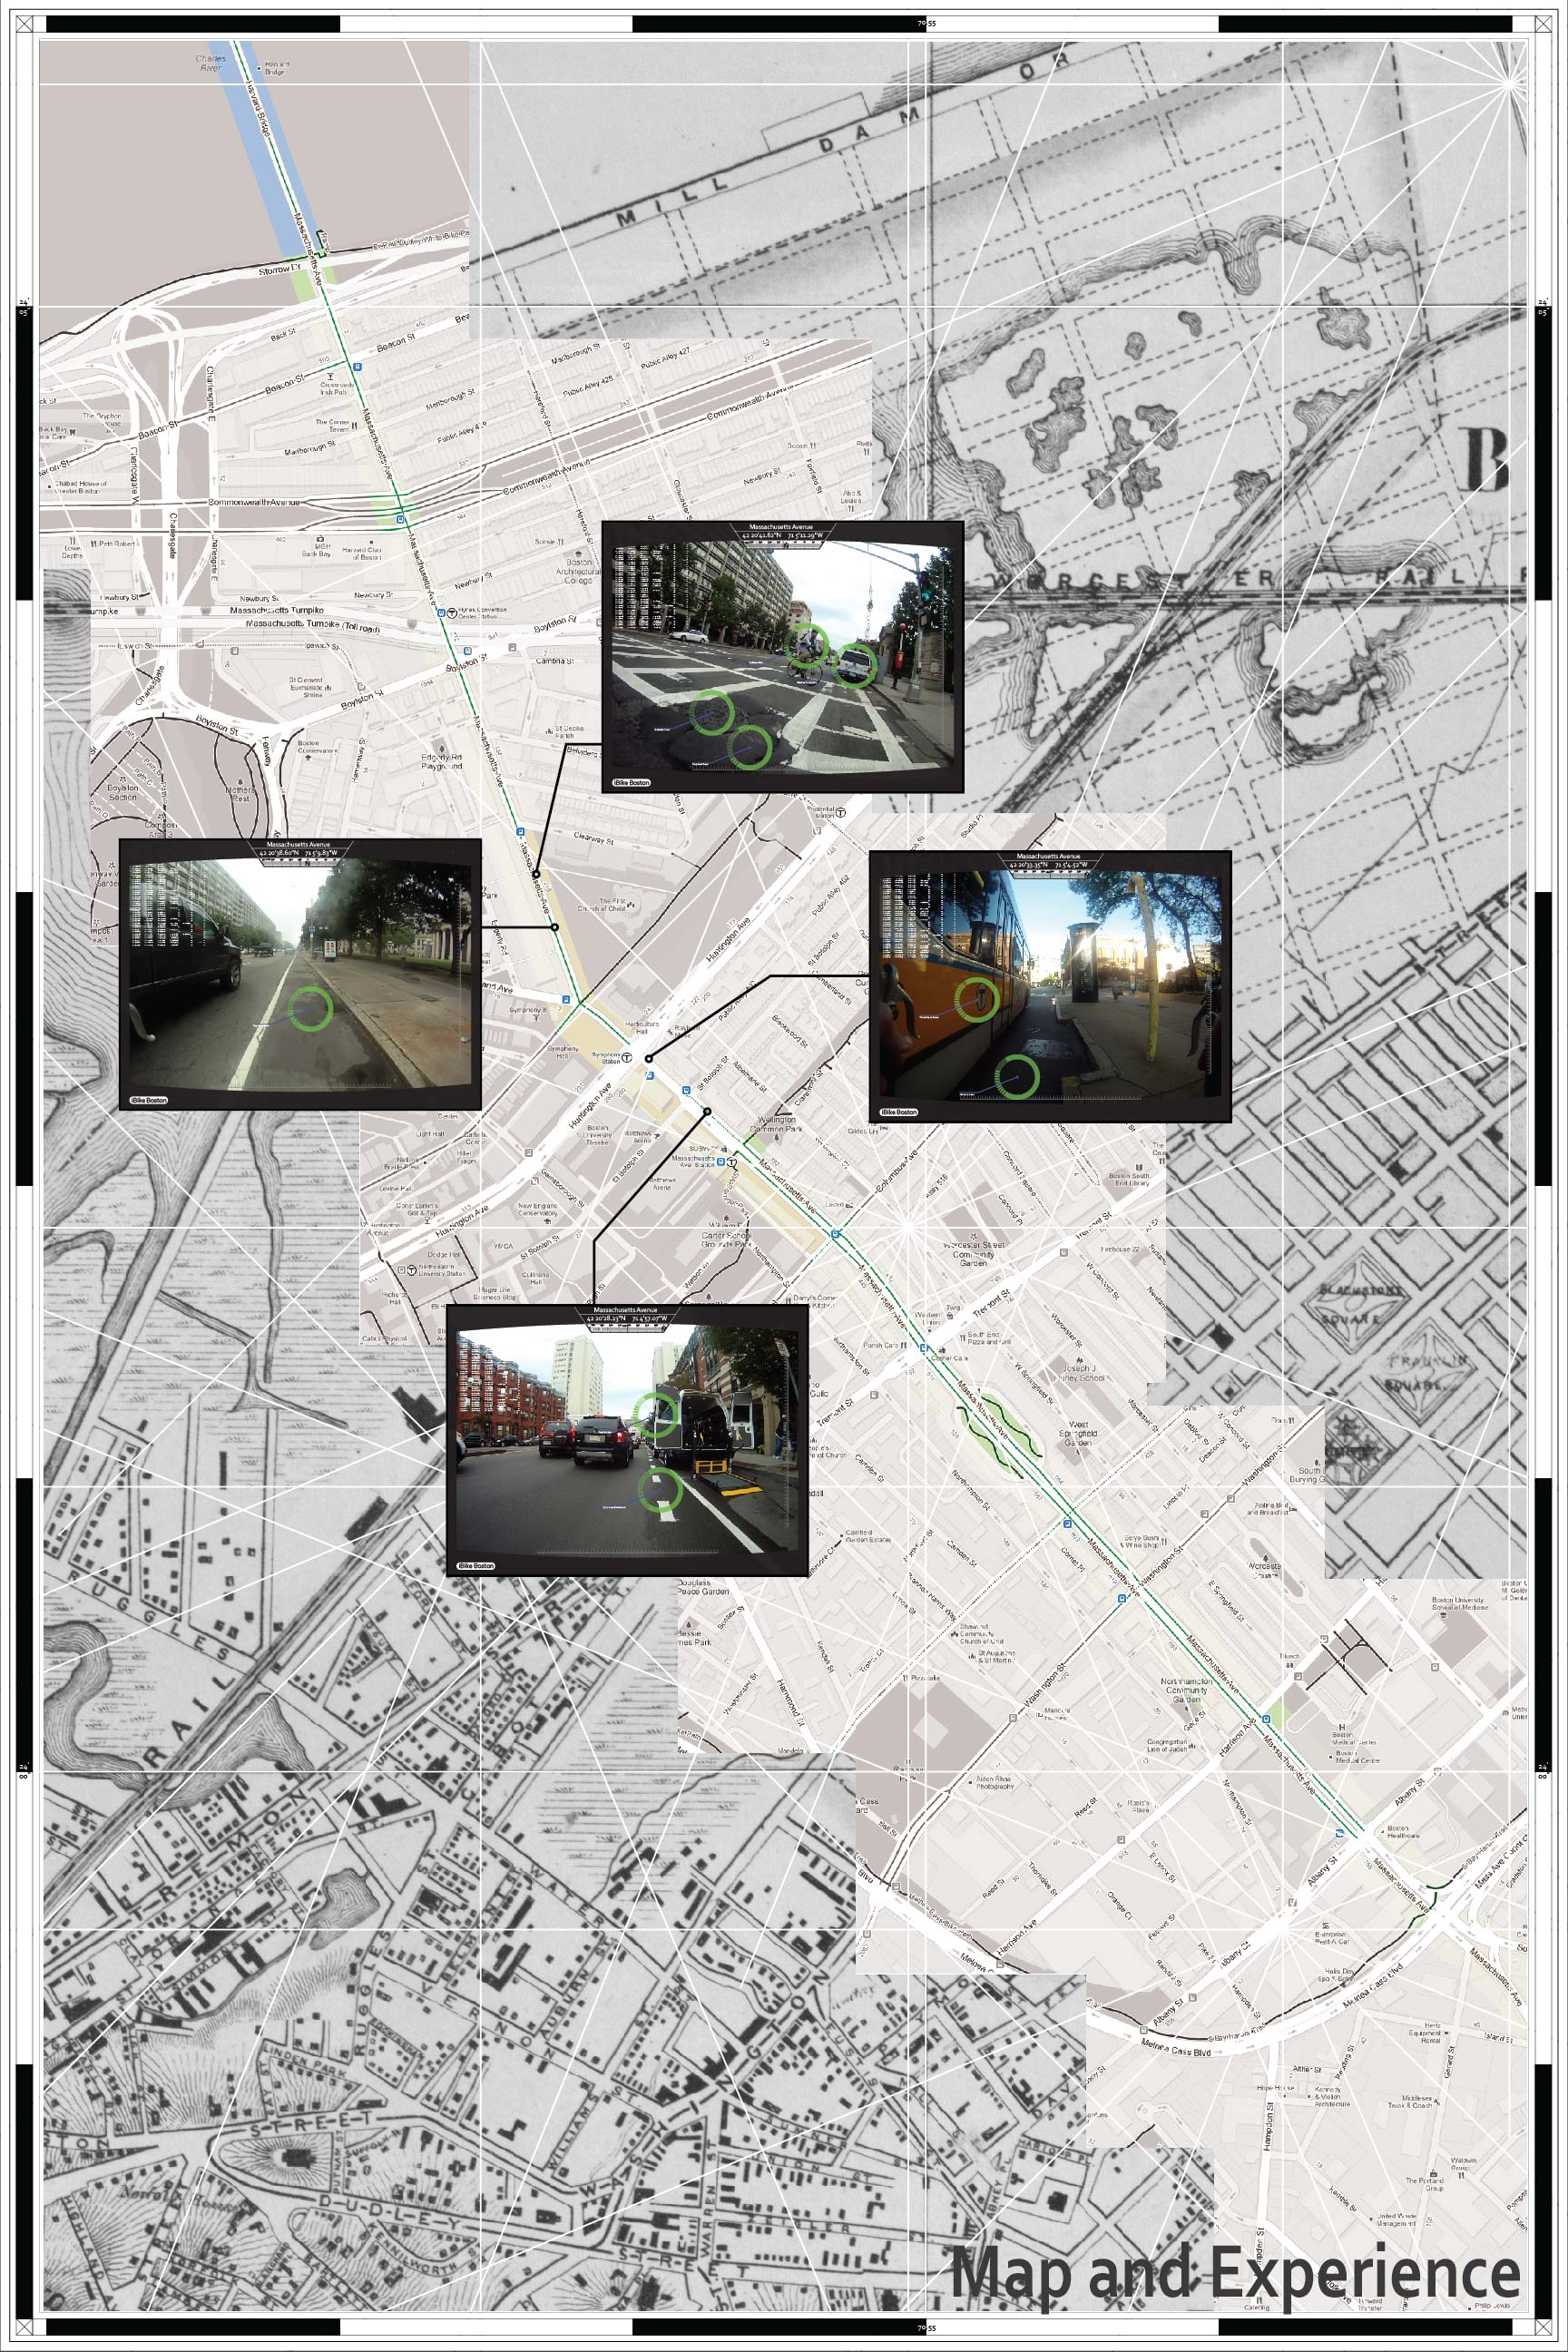
The ubiquitous google map that everyone is familiar with stands as a contradiction to the access of huge amounts of data. The flattened surface of the “map” view juxtaposed with the satellite imagery layer are presented as a complete picture of the world, encompassing all of the resolution necessary. With this dichotomy of the ultra simplified map and satellite imagery a certain thickness of information that had been drawn into maps for centuries has been wiped away. Further, the ubiquity of data collection devices (smart phones with gps, etc.) bring to question why modern cartography has largely been simplified (perhaps because of the ubiquity of data collection and dissemination).
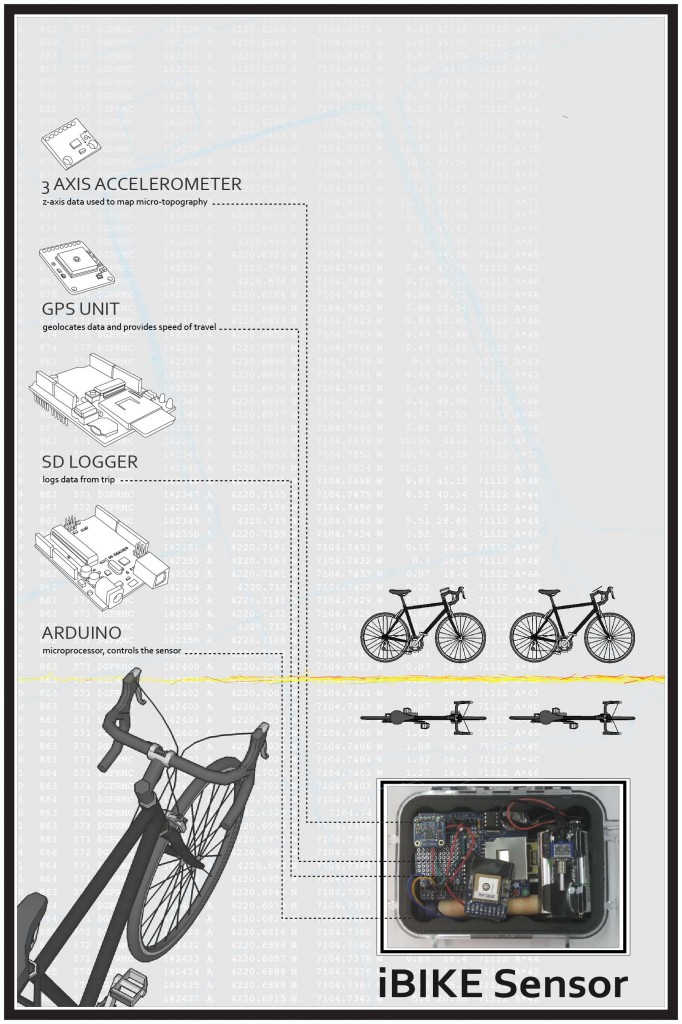
From this research I decided to explore how a thicker more informative cycle map could be drawn, to remap the city drawing the experientiality of cycling. To do this I built a sensor to mount to my bike in order to map data related to the experience of the ride. I focused in on two parameters to map, micro-topography and speed. I used an accelerometer to map the micro-topography; using the z-value from the inertia sensor I was able to map the feeling of the road while riding. A GPS was used to geo-locate the information and to provide speed data. The width of roads is drawn based on the speed of travel (faster roads feel wider) and the micro-topography is drawn by increased density of marks when viewed at the neighborhood scale and as a color gradation at the larger scale. The resulting maps provide the cyclist with a layer of information absent in existing cycle maps that relates directly to the human experience. The limited parameters of micro-topography and speed provide quite a bit of information pertinent cyclists, as the yare two major factors in the comfort of a ride. Additionally the use of the accelerometer and GPS allows for future scalability as most, if not all, smart phones have these two sensors built in. With the intention of turning this into an app crowd-sourcing data iBike can redraw the city based on the experience of cycling temporally, showing conditions as they change. The maps have the ability to transition as road change, construction begins and ends, even diurnal maps can be created so that the cyclist can better understand what the riding conditions are likely to be when they set out.
![0.18_Park_1 [Converted]](http://networkedurbanism.com/wp-content/uploads/2012/12/Park-and-Back-Bay.jpg)
Developing into the future I am looking to formalize iBike Boston into a crowd-sourced digital mapping system, drawing thick user based maps that redraw the city based on experience. Additionally I am developing sensor packs to measure other inputs that affect the quality of cycling. By collecting and mapping this data I am looking to impact the way we urbanize our city and environs, the city exists as a system of people, not of cars and our infrastructure should reflect that.

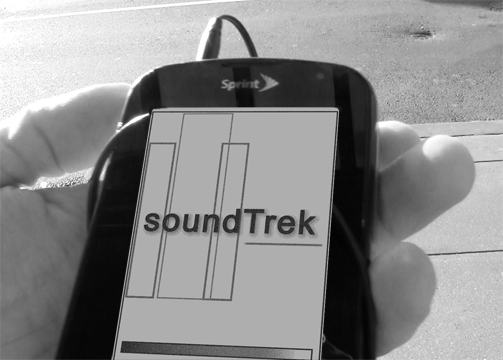
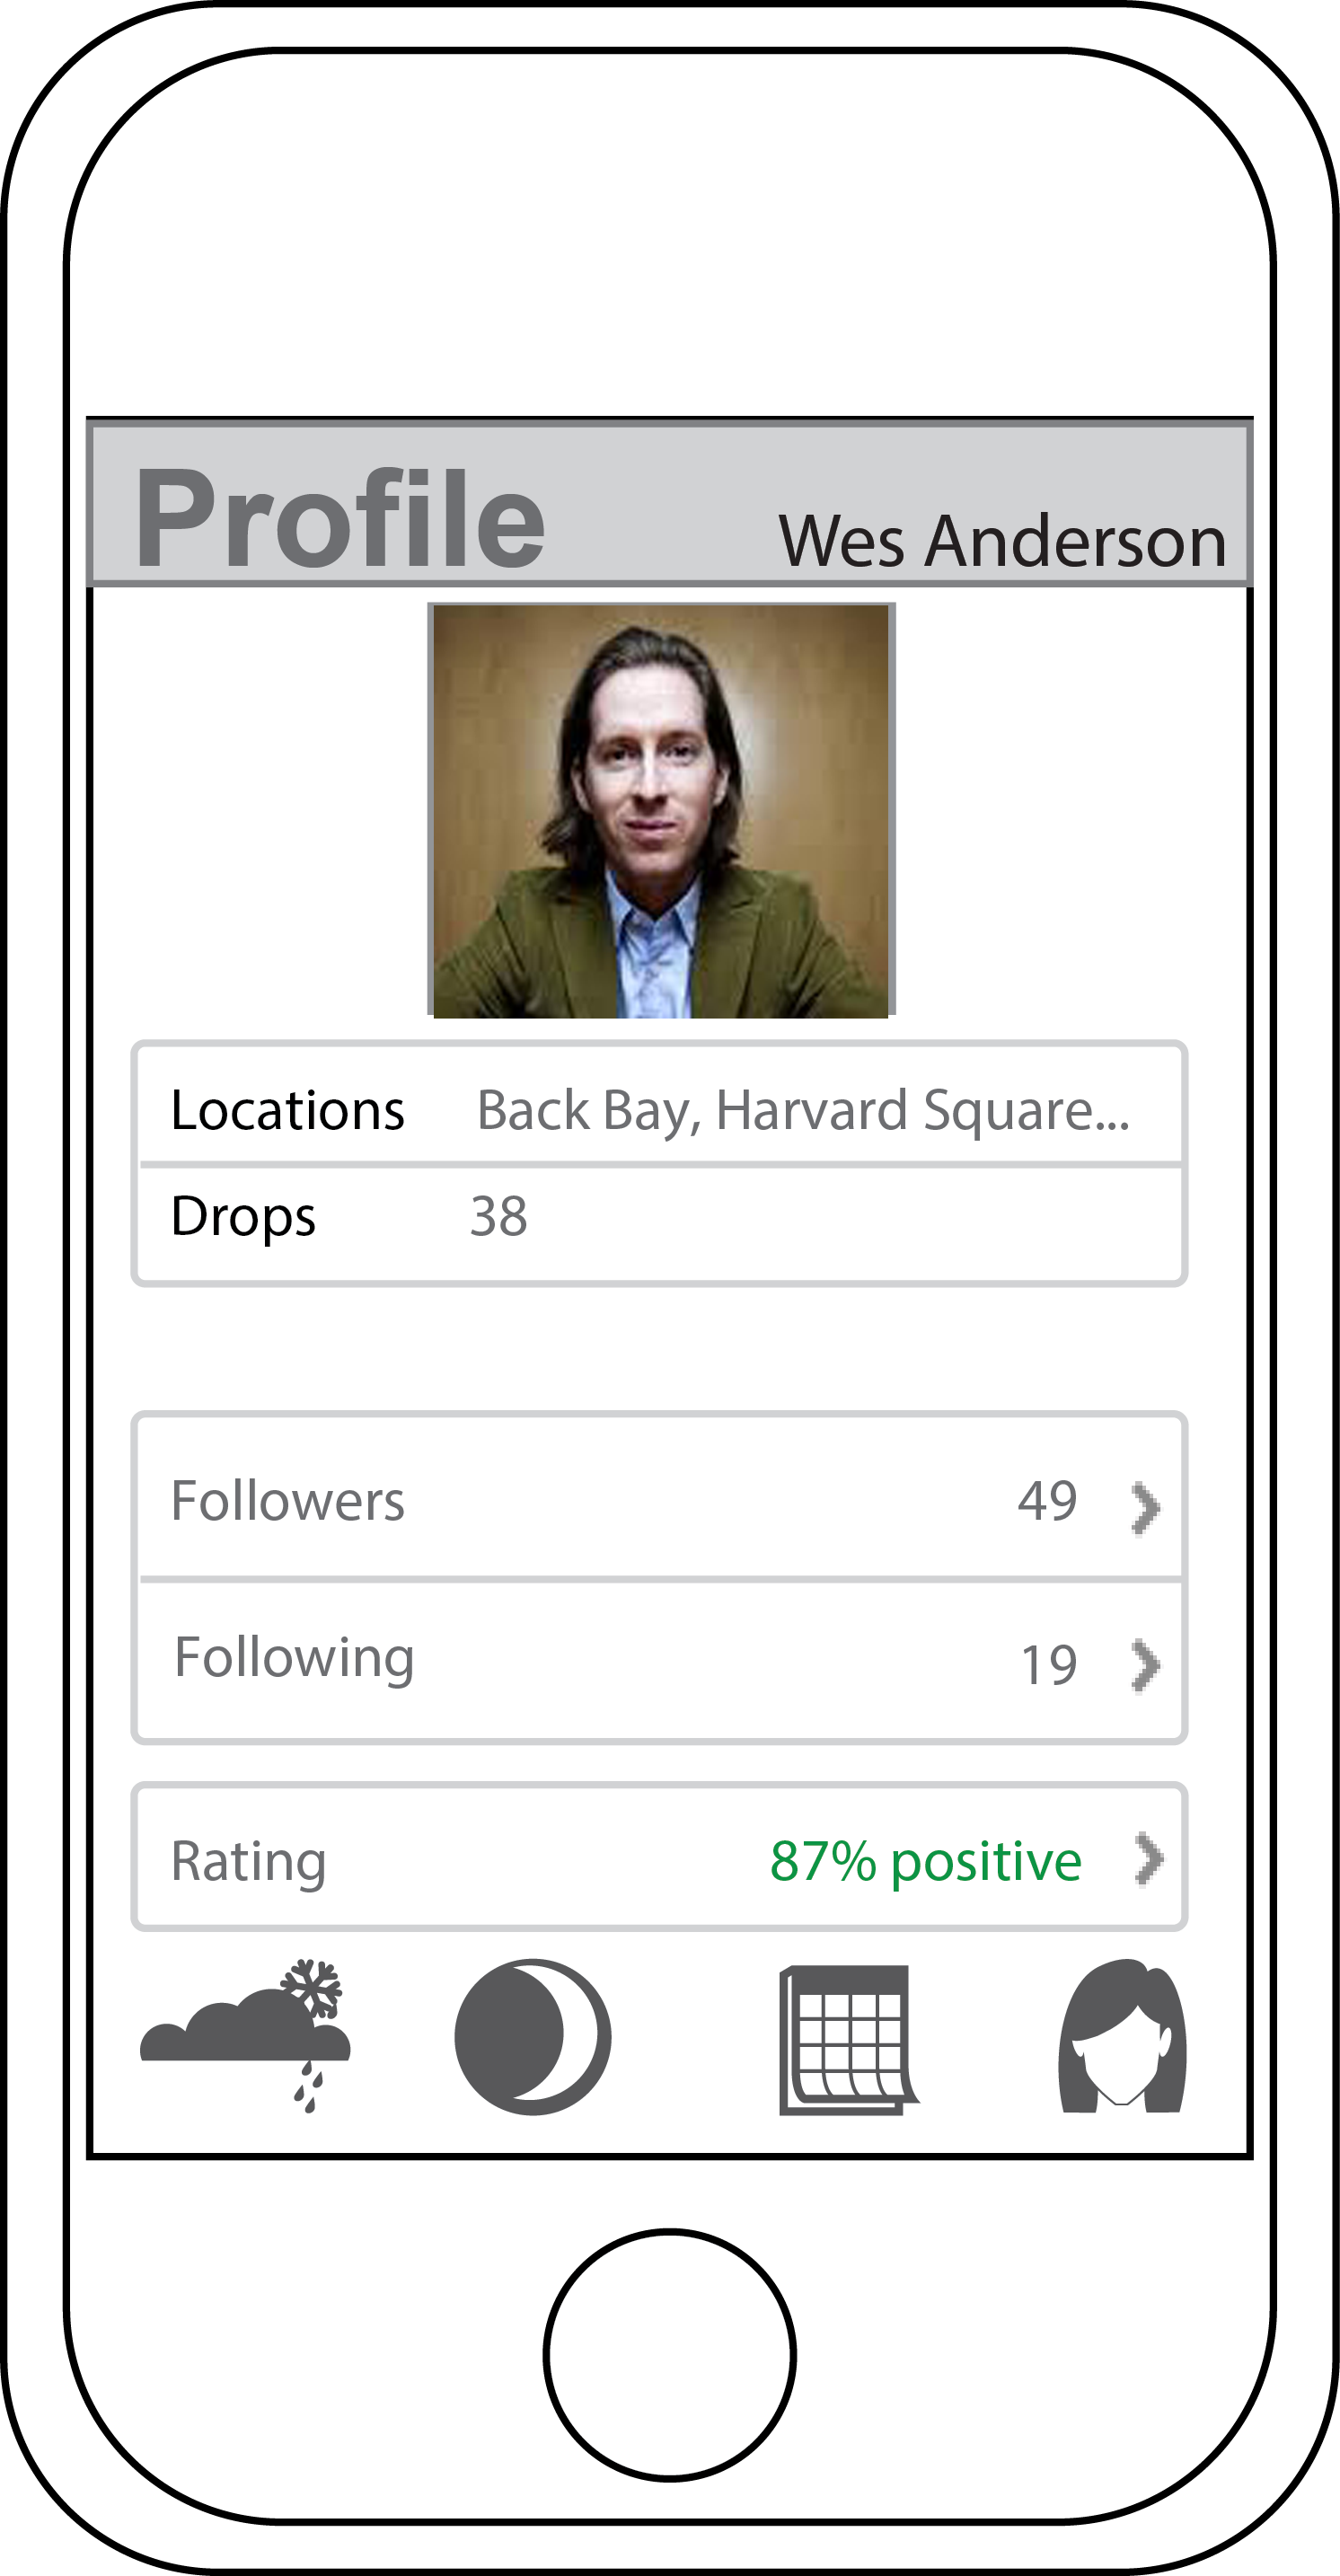
SoundTrek activates space psychically and emotionally by framing and sharing user experience of space in real time and along several experiential axes. SoundTrek is a socio-spatial music sharing mobile application that curates user generated playlists to play back to other users only under specific conditions. Songs are geo-coded and pinned to coordinates along with time, season, weather conditions and user information enabling users to discover, often by surprise, music tied to the spaces they use.
Space + experience = place
In this equation, the built environment plus the experience of that environment equals “place”. In 2006, the Project for Public Space asked people how they define “placemaking, “ and by far the most frequent and compelling answers included; connection, memorability, shared stories and experience, humanity and the purposeful creation of character and meaning in public spaces. While “place” and “placemaking” often refer to the physical activation of the built environment through design and alteration promoting, usability, the question remains that perhaps there are more subtle techniques that lend themselves to achieving the goals laid out above.
What it takes to “know” a space? What experience of the space leads us to feel connected, to remember, to share, and to feel a space has character and meaning? How did we learn about the spaces we know? What was the lesson and who gave it?
Process
Finding the entry point for this project was no easy task. With the equation above as a template, various ideas were developed from interviews with community activists in Jamaica Plain and East Boston, and videographers in New York City. These included: Pop-up playgroups based on real-time population data delivered from neighborhood playgrounds, the field and playtime allocation for pick-up soccer games in the city, a project on segregation and public space, and a video mapping project based on MyBlockNYC.org.
The project finally landed on Boston’s tour guides, specifically Boston Duck Tours and Cambridge Historical Tours in Harvard Square. Interviews with two of the tour guides who work for these businesses were instrumental in furthering and honing the idea that resulted in SoundTrek. Often tour guides are professional actors who may or may not live in the area. Their job is to entertain. While they pride themselves on their research and local knowledge, they are often directed to recommend certain places and businesses in the city. They share historical and trivial anecdotes about the actual built environment and but their lessons lack the experiential element of the space, thus depriving it of “place.” Adding the element of experience to the lesson of space led to interviews and videos of local people who shared their “favorite places in Boston.” Locals can teach us about both space and their personal experience in the space, but does their experience resonate with us?
 Needle Drop
The ‘needle drop’ is a term used in movies when popular music is laid on a scene in place of traditional score. Nobody knows this better than Quentin Tarantino. Tarantino explains his attention to detail when it comes to music in film in an interview with Arts District. “To me, my soundtracks work as two different things. They work as a little shadow version of the movie itself. If you like the movie and you want to carry it around with you and not have to watch the story all the time but still get the feel and sense of it, they allow you to do that.” Music can be used as shorthand to quickly illustrate a state of mind, an emotion or an experience, it is intimate and connecting. When watching a movie, one knows exactly what to feel at any moment via the scene and soundtrack. SoundTrek would allow users, much like a film director, to frame their real-time, physical scene by “dropping” the perfect audio track to capture the moment and then share that moment with an audience of other users. With one song users could share the idea that “this is me in this space at this moment” thus transforming a space into a place and achieving some of the goals of the Project for Public Spaces; connection, memorability, shared stories and experience, humanity and the purposeful creation of character and meaning in public spaces.
Mapping/Data
The final review of SoundTrek, the idea and rough design, raised interesting questions about data collection and analysis. Presumably one could take the emotional temperature of a city or even a part of the city using the songs and playlists as data points. Over time, cities could be compared to each other and a better data metric for “happiness” could be established. Another interesting piece could be data collected over time in a single city and how the music sharing related to changing demographics and ethnography.
 Final thoughts
SoundTrek is an idea and application that works best in an urban setting because living in the city increases the odds of serendipitous encounters. SoundTrek is the record of a personal moment, though ephemeral, that can lead the user to new discoveries, experiences or feelings. Its expression as a mobile app does not hinder the rhythm and movement of the user through the built environment. SoundTrek is calculated urban serendipity, a romantic, sentimental concept perhaps, but one that provides emotional, intimate, spatial connection in otherwise routine and anonymous urbanity.
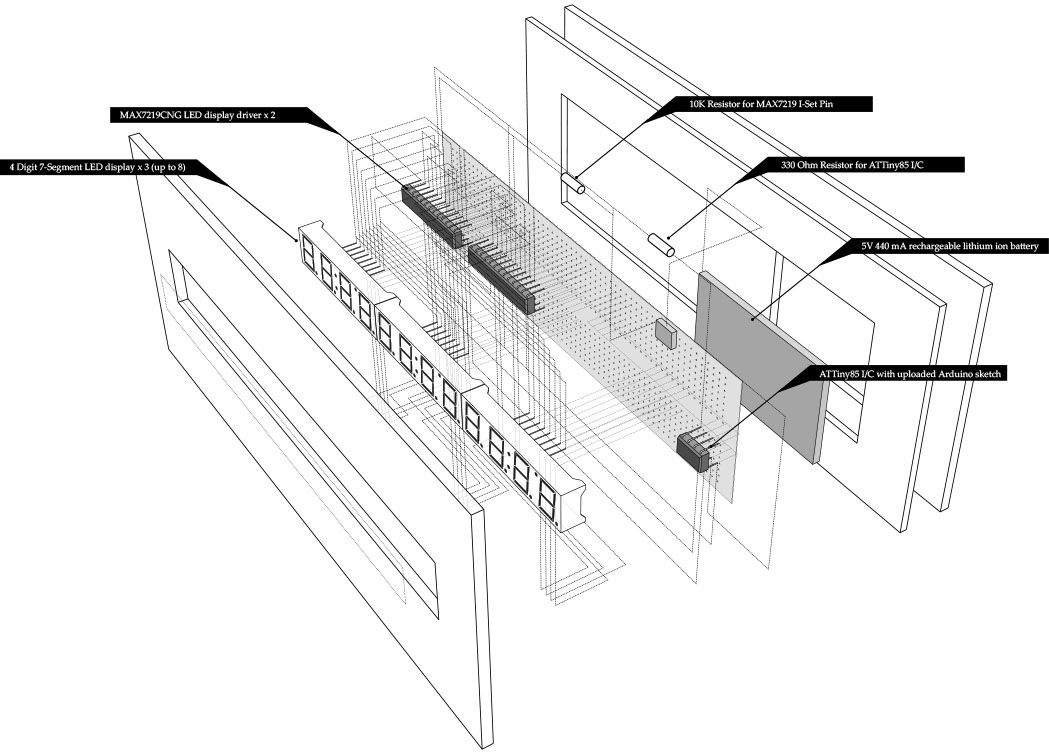
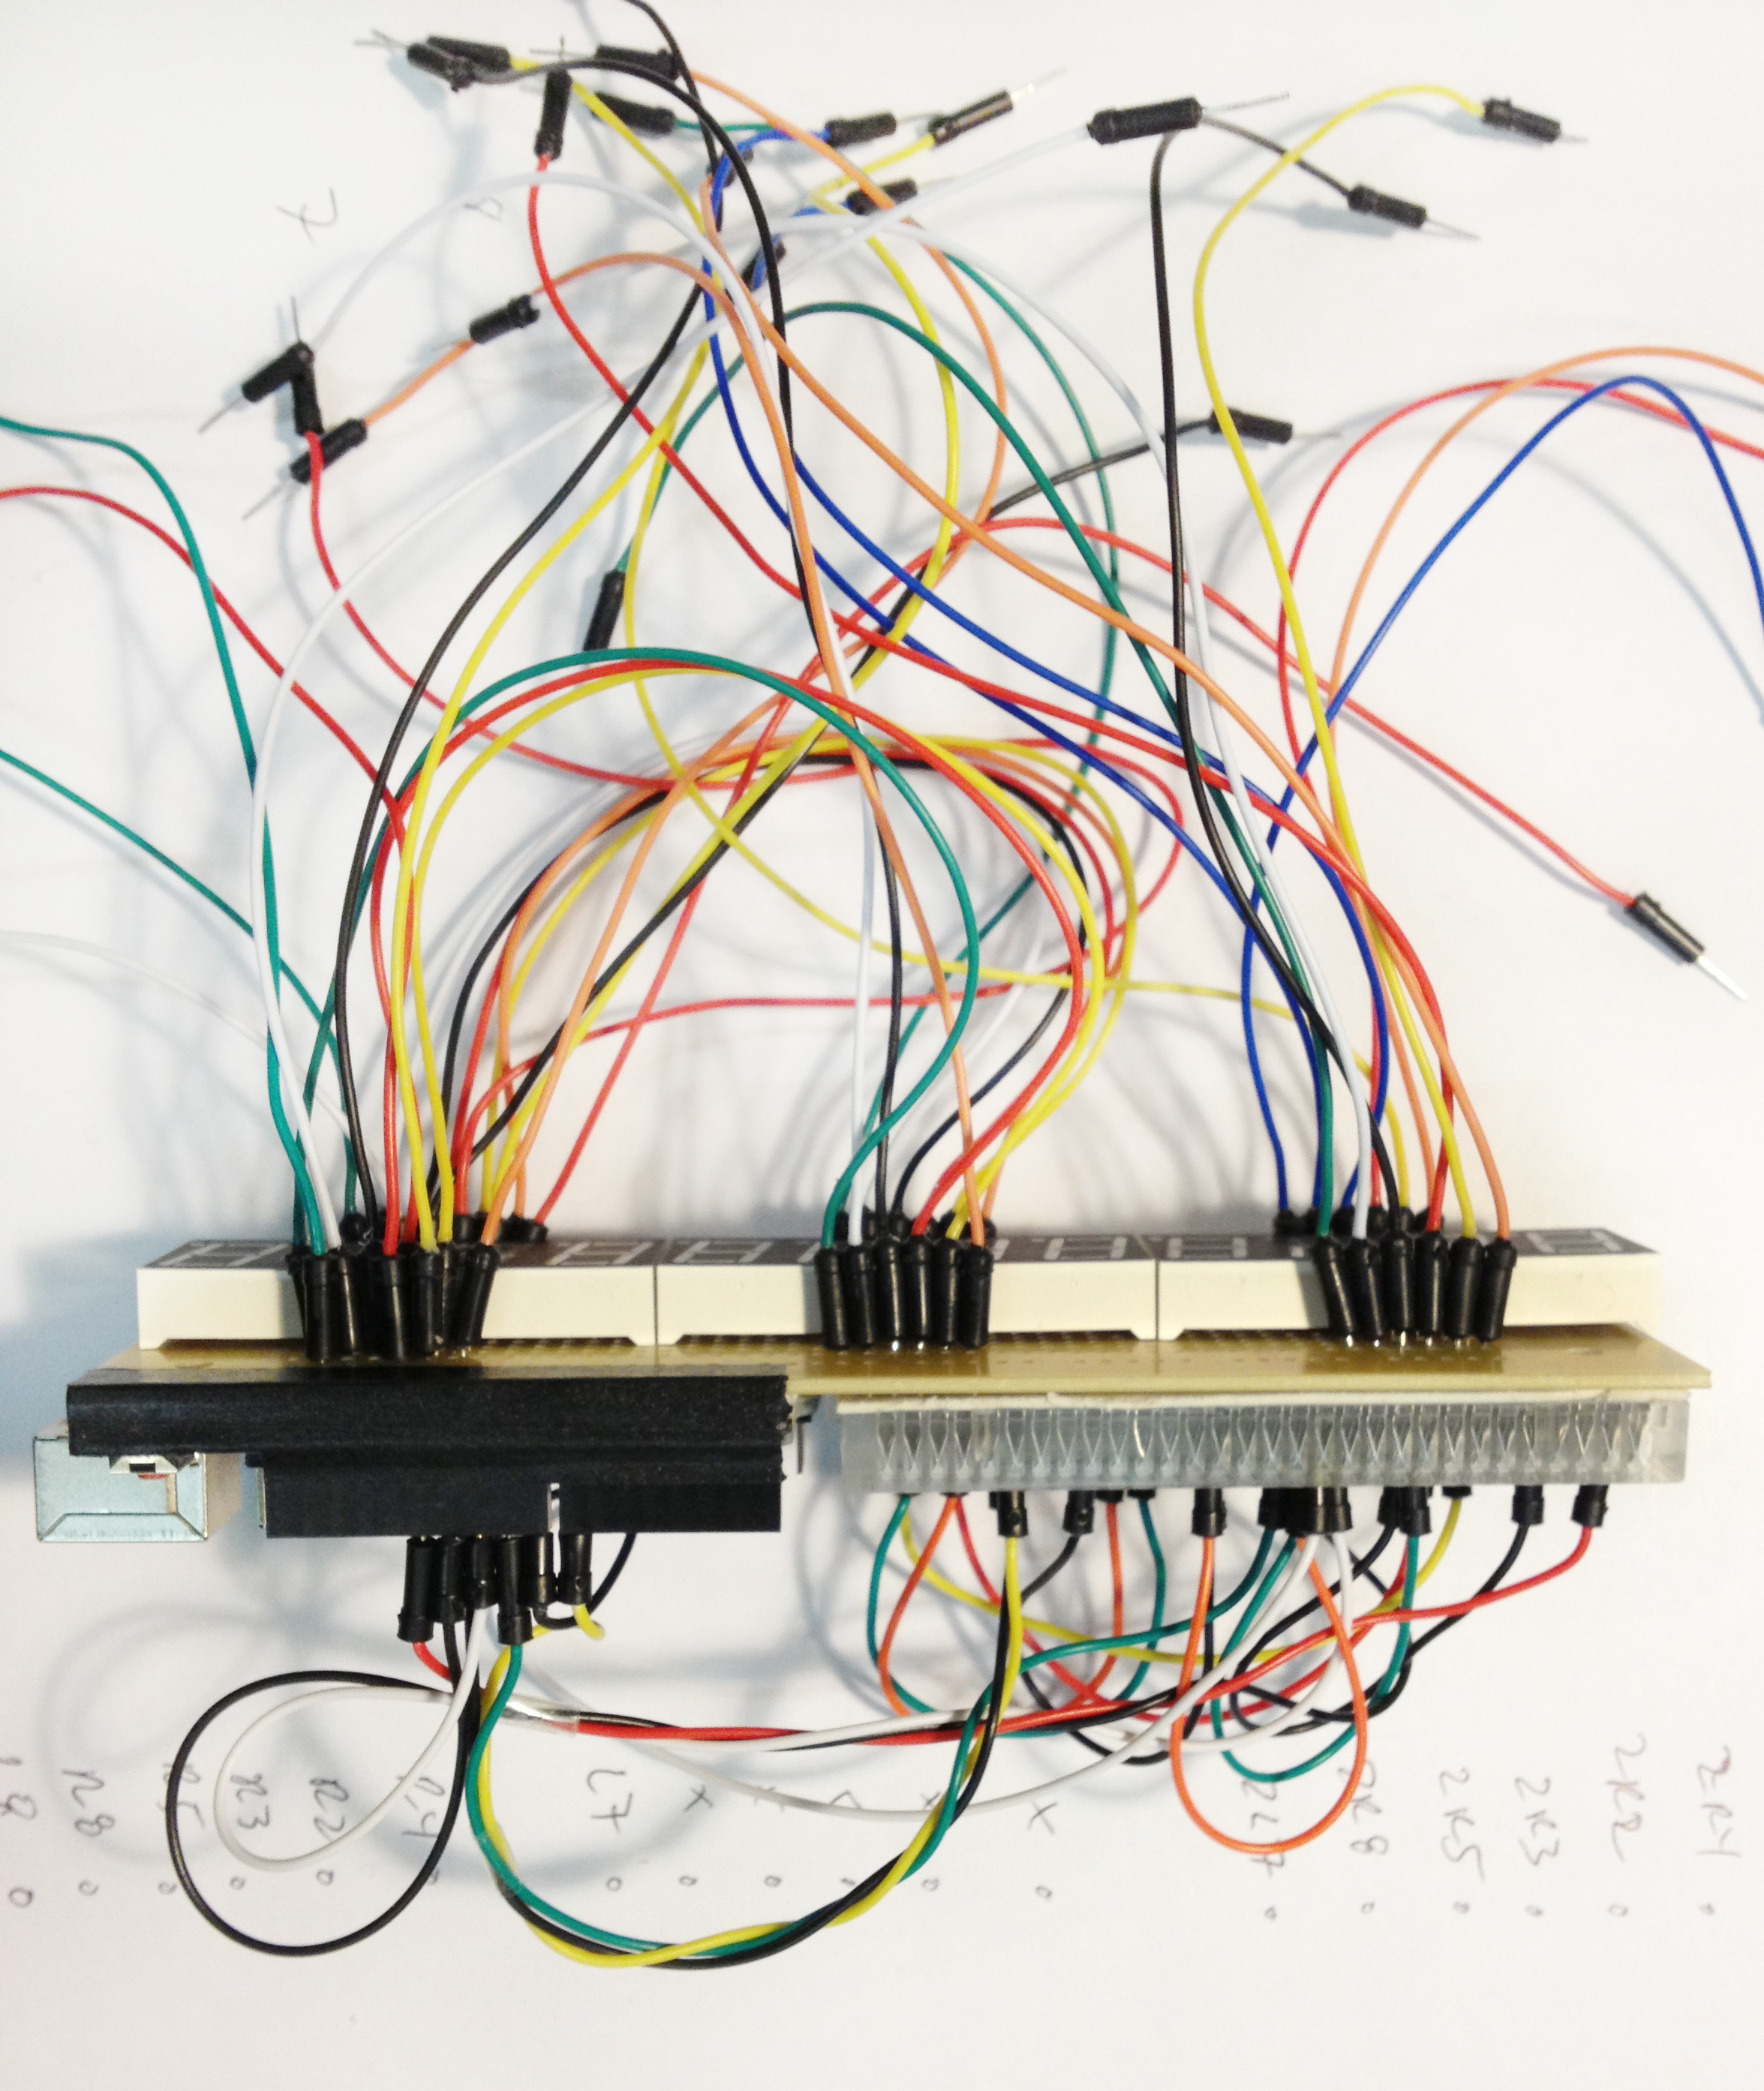
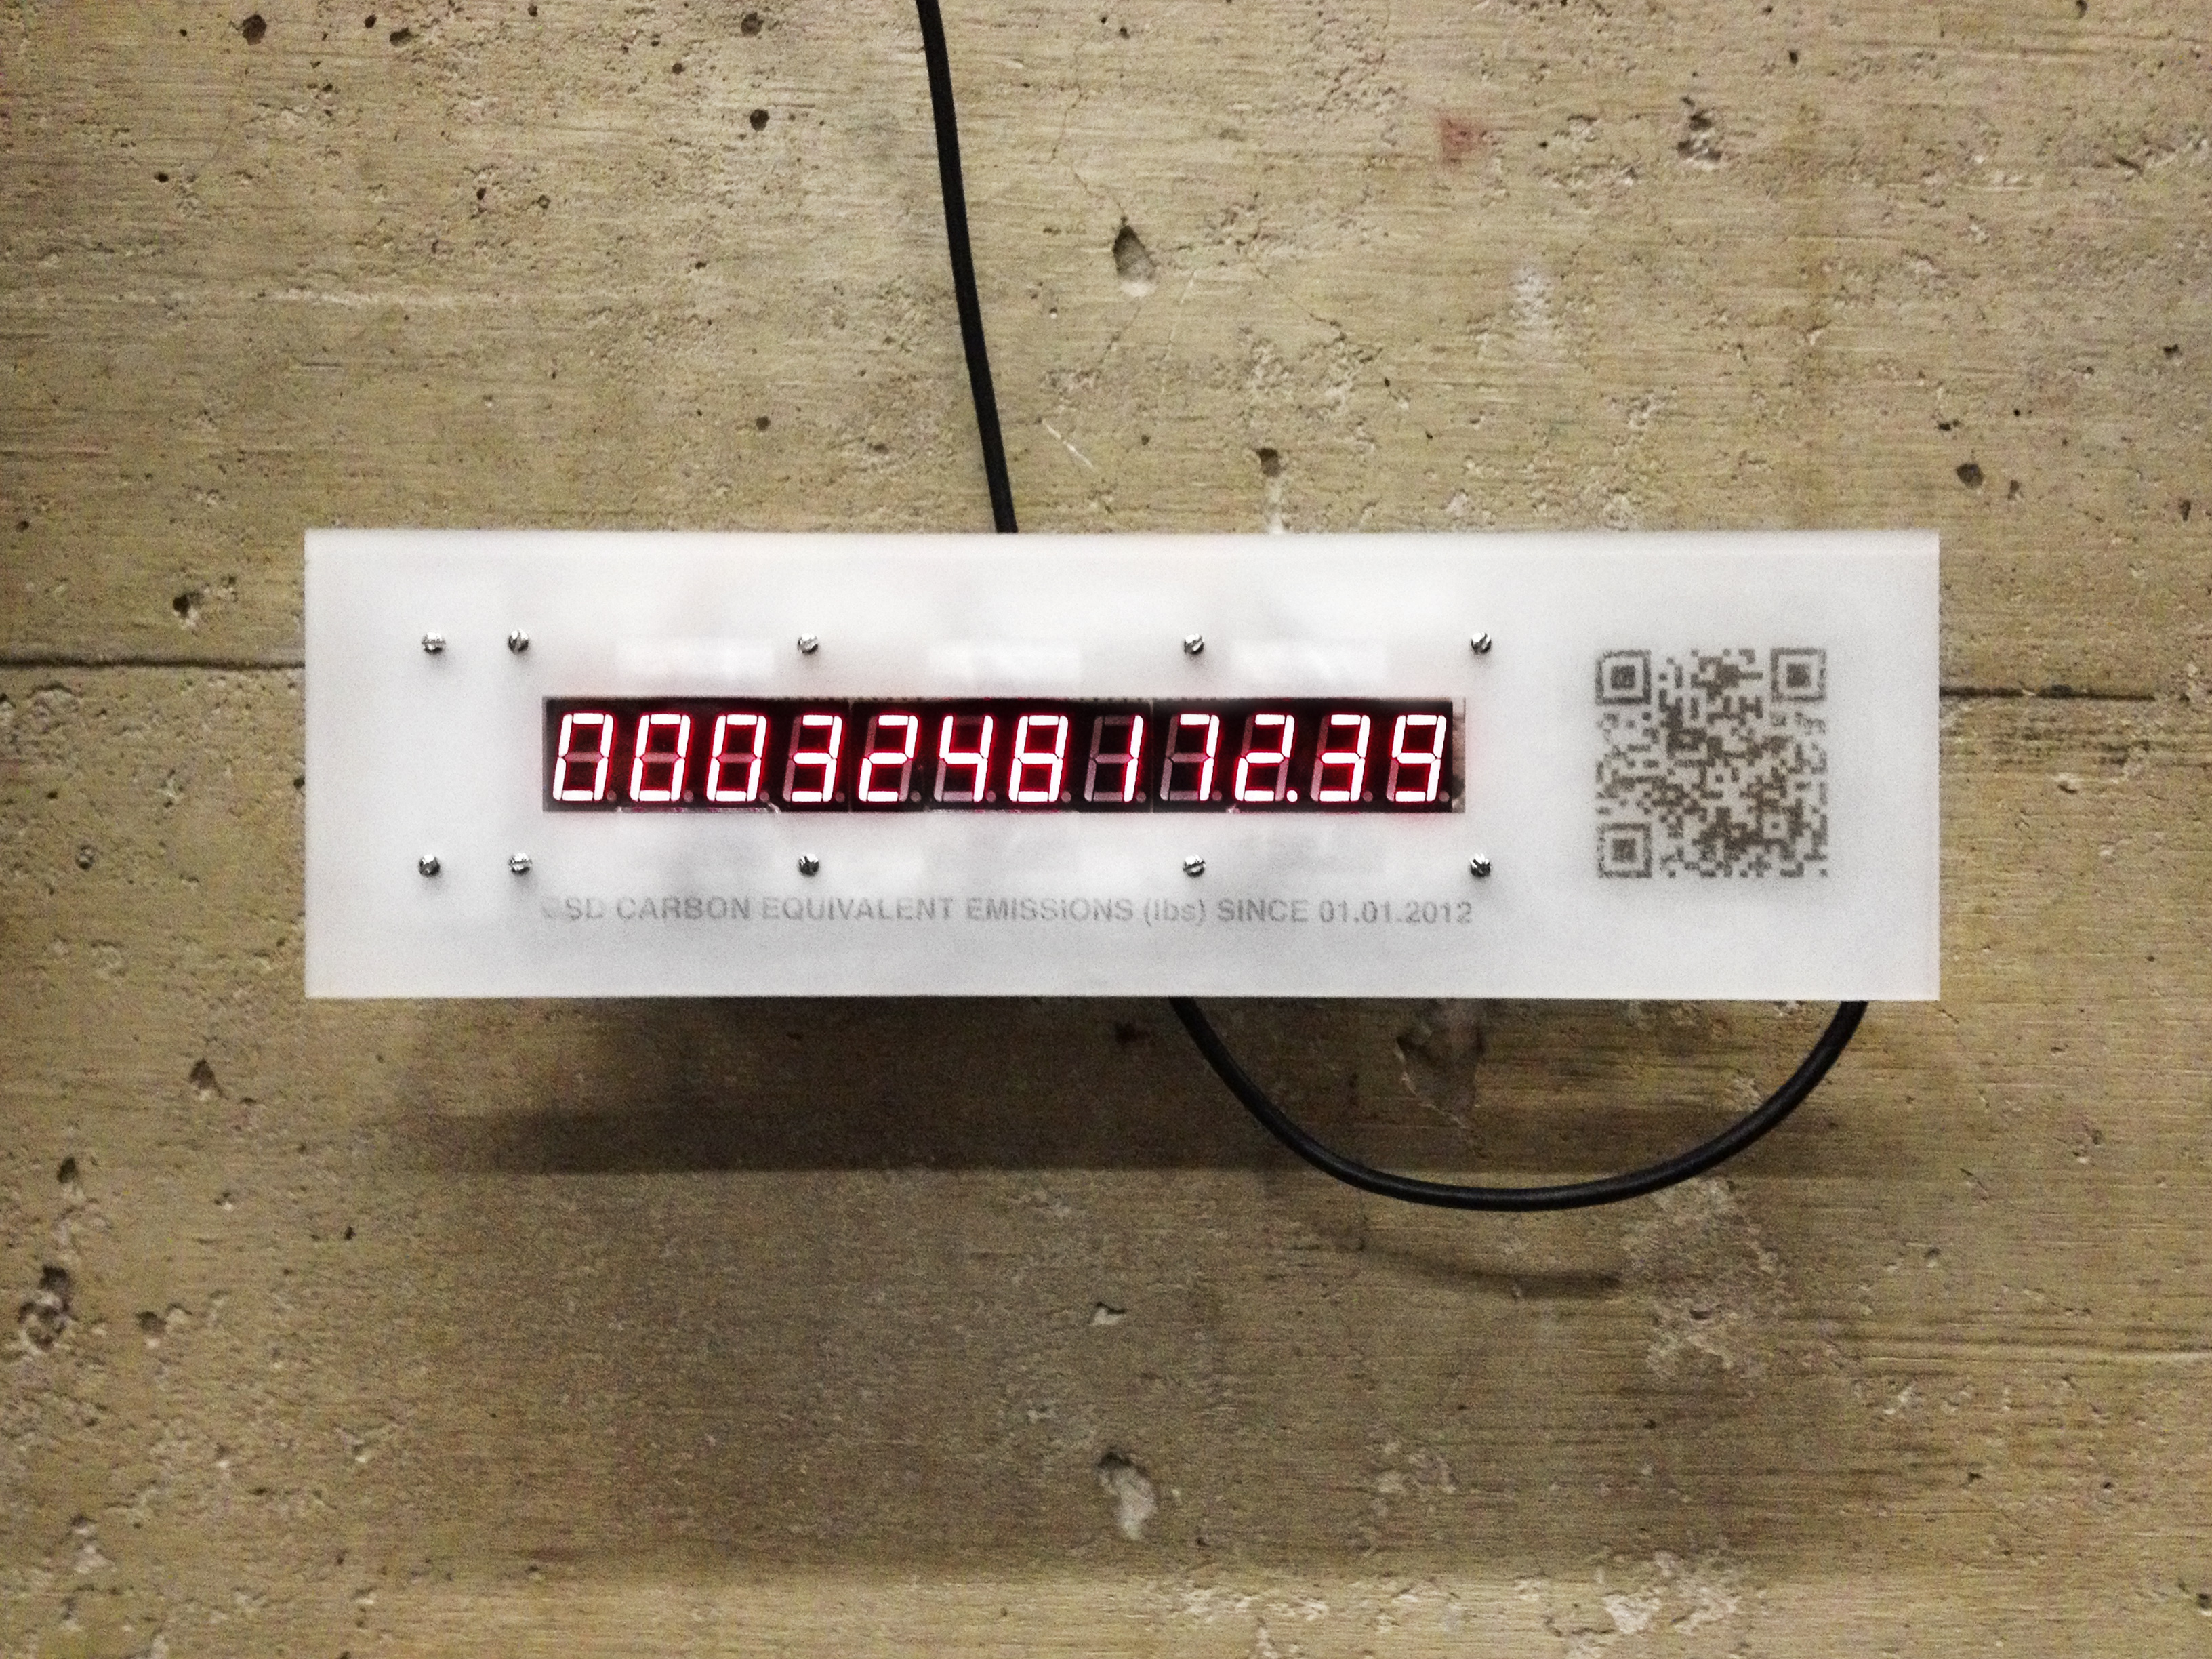
The carbon counters (in both physical and digital form) are meant to stimulate discussion about carbon emissions and climate change at the school of design. The impact that our buildings have on the environment is an issue that is often glossed over at the school of design as it is in most public discussions. If we want to address our concerns for the environment, issues of climate change need to be brought into our collective consciousness and that starts with raising awareness about own carbon footprint.
Climate change is an issue of global concern, with deep roots connected to everything from aging infrastructures to shortsighted policies and regulations. However climate change is also largely the result of behaviors caused by a lack of awareness about the impact our actions have on the environment. Every time we use our computers, turn on the air conditioning, or take a shower, we are releasing carbon into the atmosphere and contributing (in a small but nonetheless significant way) to global climate change. As a result of this general unawareness, people leave their lights on during the day, turn the air conditioning on high in the summer, and take hot showers longer than necessary – exacerbating the problem of global warming.
This semester began with an assumption that educating the public about the way our built environment works, specifically the way our built environment uses energy and contributes to the problem of global warming, has the potential to correct some of our more problematic behaviors. One component of education is finding ways to visualize the invisible yet ubiquitous energy infrastructure and how that infrastructure operates. The other is to visualize the real-time impact our buildings have on the environment, and in so doing affect the decisions we make regarding how we interact with the built world.
While there are undoubtedly many ways to communicate this information, the studio was an opportunity to experiment with an unfamiliar medium: animation. The first experiment involved an animation describing the movement of energy from the point of resource extraction to the point of consumption (the city of Boston). Since Boston, like many northeastern cities, creates most of its useable energy from burning natural gas, the animation begins in the Mississippi Delta where most of the nation’s natural gas is processed before it travels via one of several large pipelines to the electric generation facility. The fact that Boston relies heavily on natural gas for its electric generation is an important point because it enables one to calculate the amount of carbon created per kilowatt-hour of electricity generated.
This first animation was an introduction to new tools, and new techniques of representation. While it was an informative exercise, it failed to communicate the urgency of reducing our collective energy footprint. The description of resource movement from source to sink was ultimately too abstract and removed from the everyday behaviors of ordinary citizens. Using the lessons learned from this first iteration, the second animation used data collected from actual buildings to concretize what was formerly too abstract.
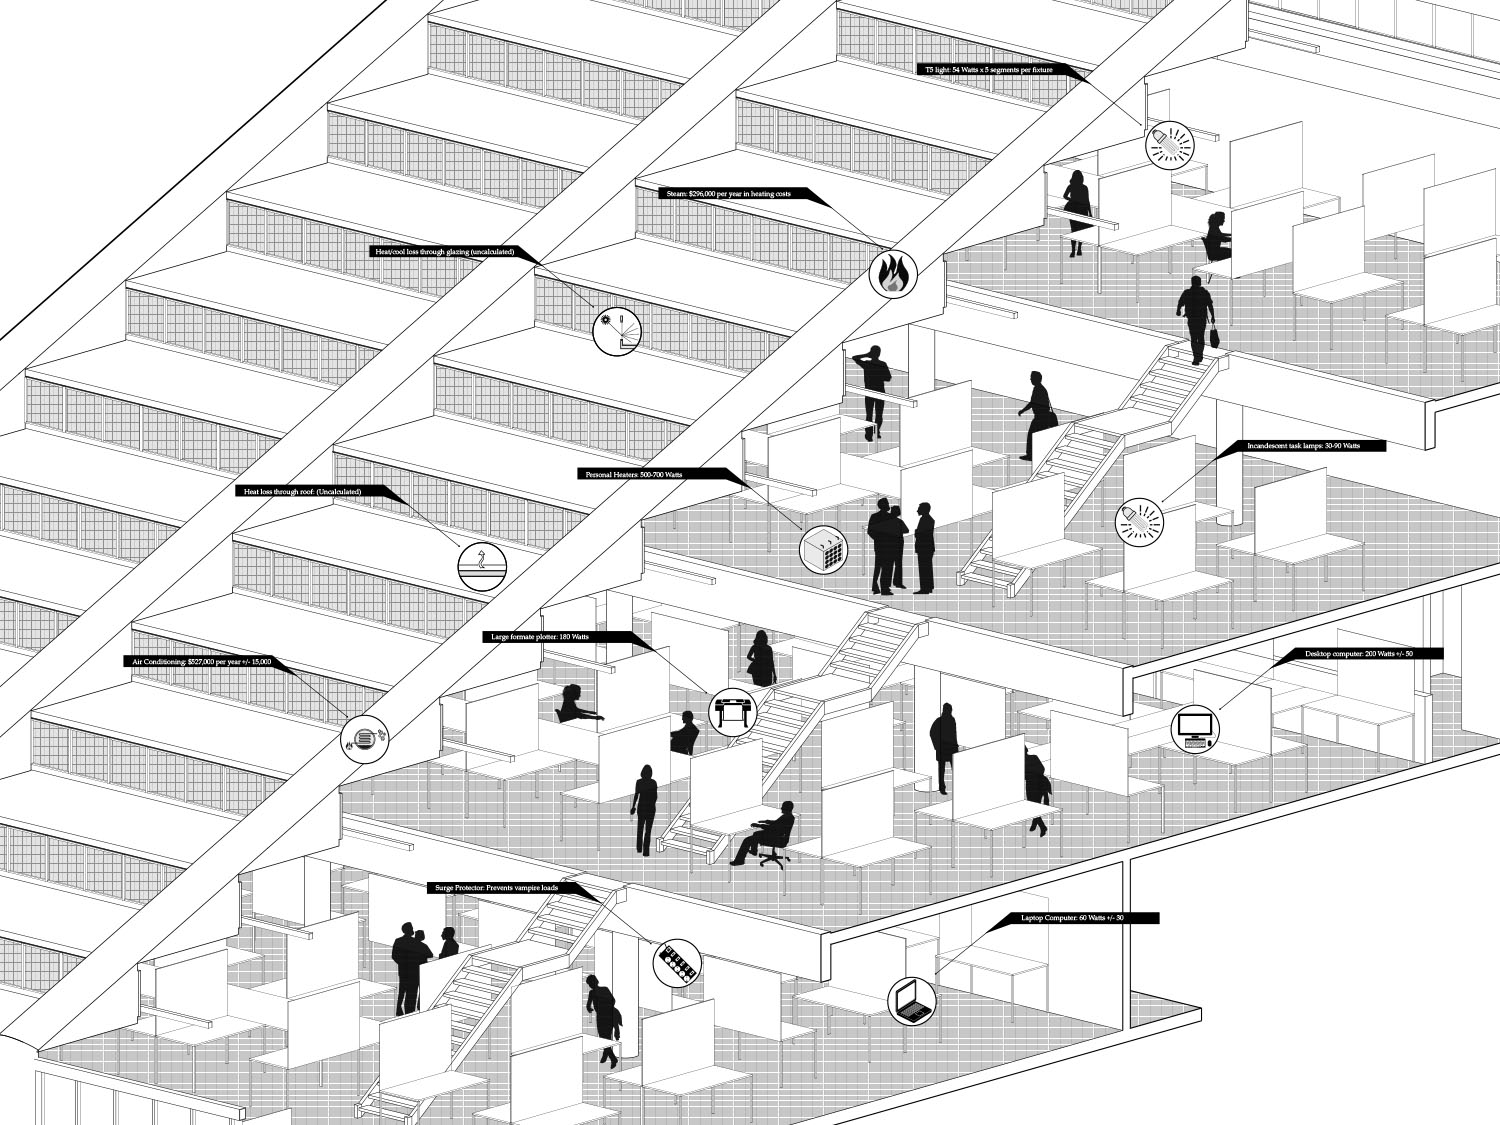
Even with the complexities involved in the processes of energy generation and transmission (deregulated markets, interconnected power grids…etc.) collecting and animating information about how specific buildings or groups of individuals use energy is decidedly more difficult. In order to streamline the research, Gund Hall served as a test kitchen because of their psuedo open data portal to energy monitoring systems. Real-time data on everything from lighting loads to steam use is continuously collected, packaged, and then emailed as a text file once per day. Using this information, the numbers in the animation are presented in traditional terms, such as a Kilowatt-Hours for electricity used for lighting and therms for heating, as well as comparative figures such as number of houses powered per year. For example, the amount of energy used to light Gund Hall is equal to the amount of energy it would take to power 208 medium sized houses. The numbers and figures are also presented in relation to other buildings on the Harvard campus as a way to accentuate the point that Gund uses more energy per square foot than almost any other building in the area except the Science Center (and most of this energy goes toward unnecessarily lighting the building during all hours of the day).
This animation played in the Chauhaus alongside a device that reads the (almost) real-time carbon emissions of Gund Hall. Although the output from this carbon counter is a simple number, the device was designed as an object of intrigue that people could walk up to and investigate – a dynamic and slightly more interactive type of informative poster.
These types of displays are particularly important for the design school, since we as designers are rarely confronted with the reality of how our creations impact the environment. Buildings account for almost half of all carbon emissions in the United States, and designers have a responsibility to create an efficient and responsible built environment. If an awareness of energy use becomes part of our consciousness as designers, and if we are constantly reminded of the ways in which our creations use energy, we are more likely to design and create a better built environment for the future.
FunChinese is a project aiming to connecting people with complementary language skills to share with each other. Through the physical interaction, people begin to gain not only languages but also the knowledge of another culture. More importantly, participants get a natural familiarity with a group of people rather than a single one. And further, this will bring a sense of involvement in the larger community, and more open to new things that one encounters as a new-comer.
Boston has become more and more international. In particular, from 2000 to 2010, the Asian population in Boston multiplied by 1.6. Not only do they represent a minority group of people but also they bring different cultural backgrounds.
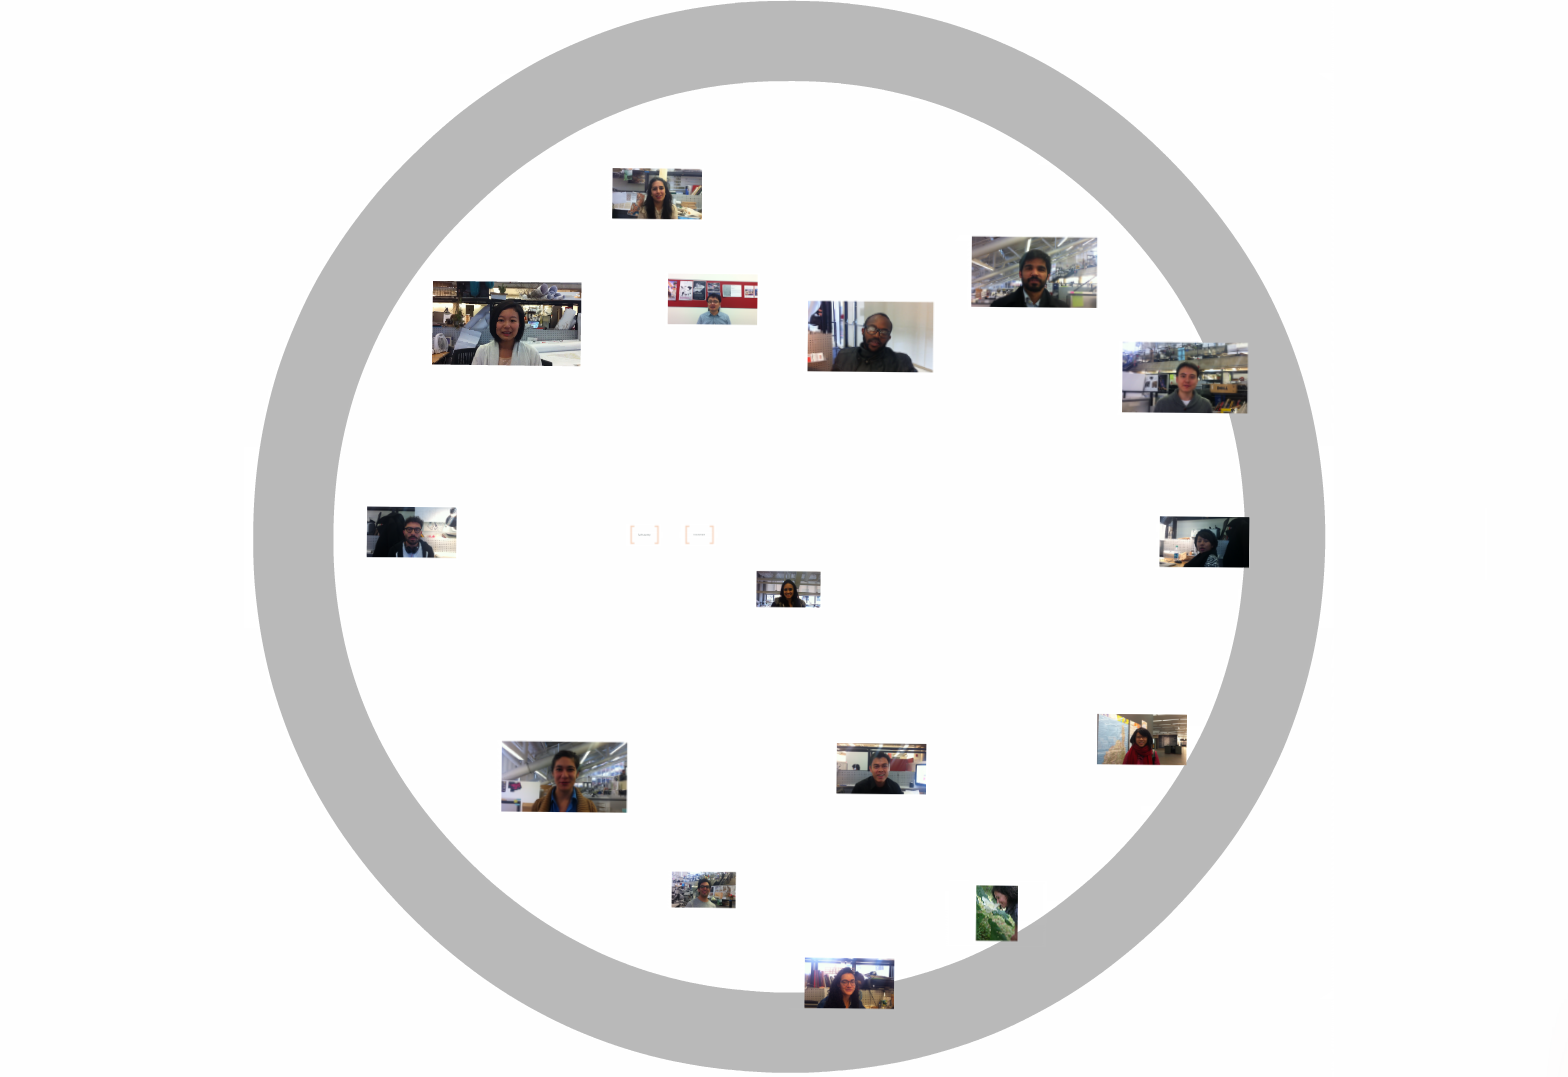
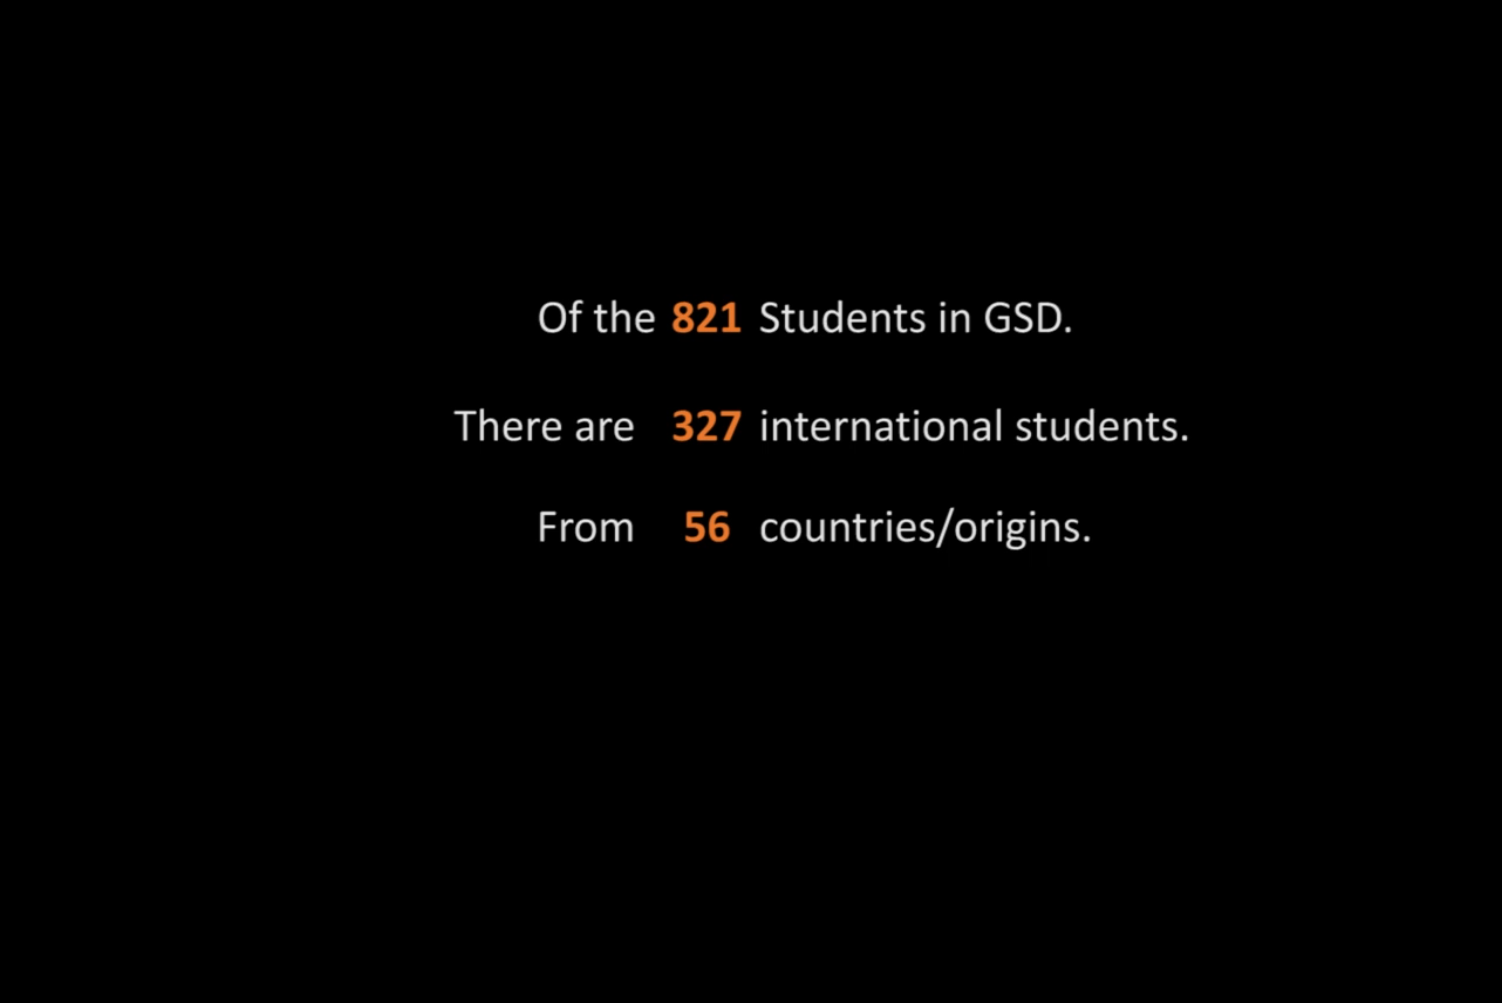
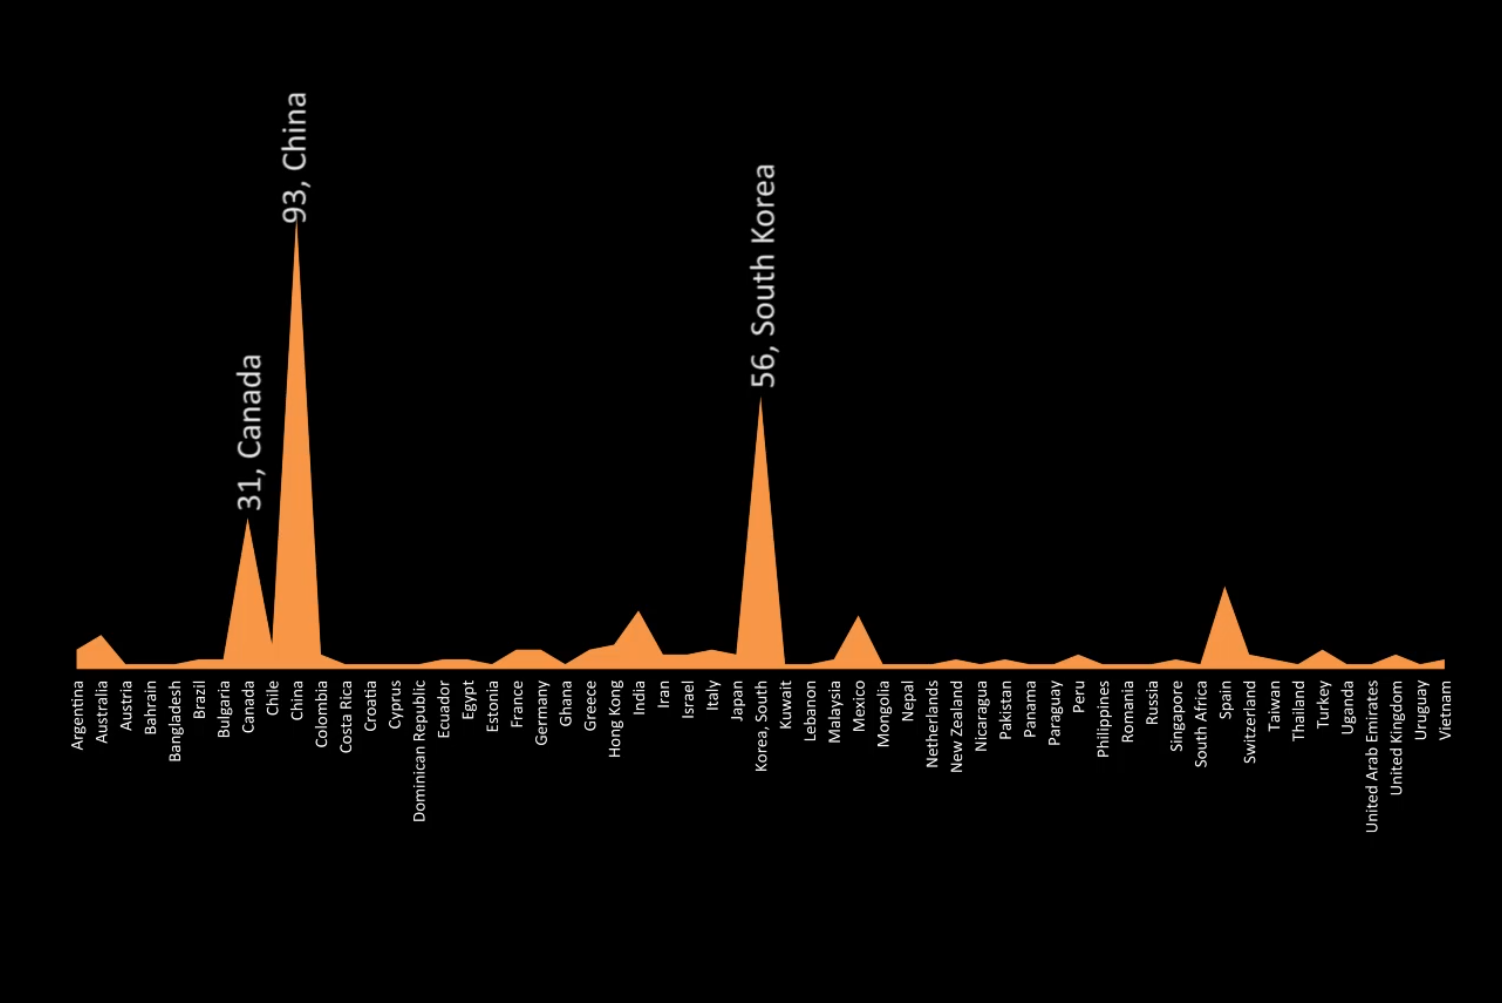
Among the growing Asian population in Boston, international students represent an important group. In the Graduate School of Design, there are 327 international students from 56 origins, which accounts for 39.8% of the 821 students. Among these students, more than 150 are from Asia, mainly China and South Korea. Since the cultural background and mindset of Asian students are fundamentally different from the western world, it is hard for them to adapt into the life in the US.
Some Asian students felt reluctant to speak or make friends. Not because they don’t have the ability to communicate, but because of a natural insecurity in a new environment. On the other hand, international students tend to stick much more to people from the same country.
As the number of international students continues to grow in the GSD and at the larger Boston area, it becomes important to help them better and faster adapt to the new environment. This will benefit international students, and also bring a more healthy and active interaction between all students.
FunChinese takes language as a tool to connect people from distinct backgrounds. Language influences the way different people see the world. It is also a door through which we begin to understand the core of a culture, its ideology as well as deeper meaning. Through the sharing of one’s own culture, students become more open to communicate with peers and thus building a more healthy connection.
International students come from a different culture and are able to bring a diverse insight in a discussion. Especially students from countries like China, South Korea, where there are many developments happening, this cross-cultural interaction could lead to professional practices.
Taking Chinese as starting point, FunChinese takes action by involving students with a Chinese background with students who have interest in Chinese language or Chinese culture, through the form of group meeting and one-on-one interaction. The project starts in the small community of GSD, and then grows in collaboration with the School of Engineering. In the whole process, this project has received highly positive support and response from participants and school directors, and is aiming to continue and expand in the next year.
By contributing to the community, members have benefited from a cross-cultural exchange. Through the weekly interaction, American participants have got the chance to know more about Chinese culture; Chinese participants have been able to engage themselves with the larger GSD community, and found a self-identity as a valuable member with a distinct and meaning cultural background.
FunChinese takes Chinese as a prototype of promoting cultural communication through the means of language.
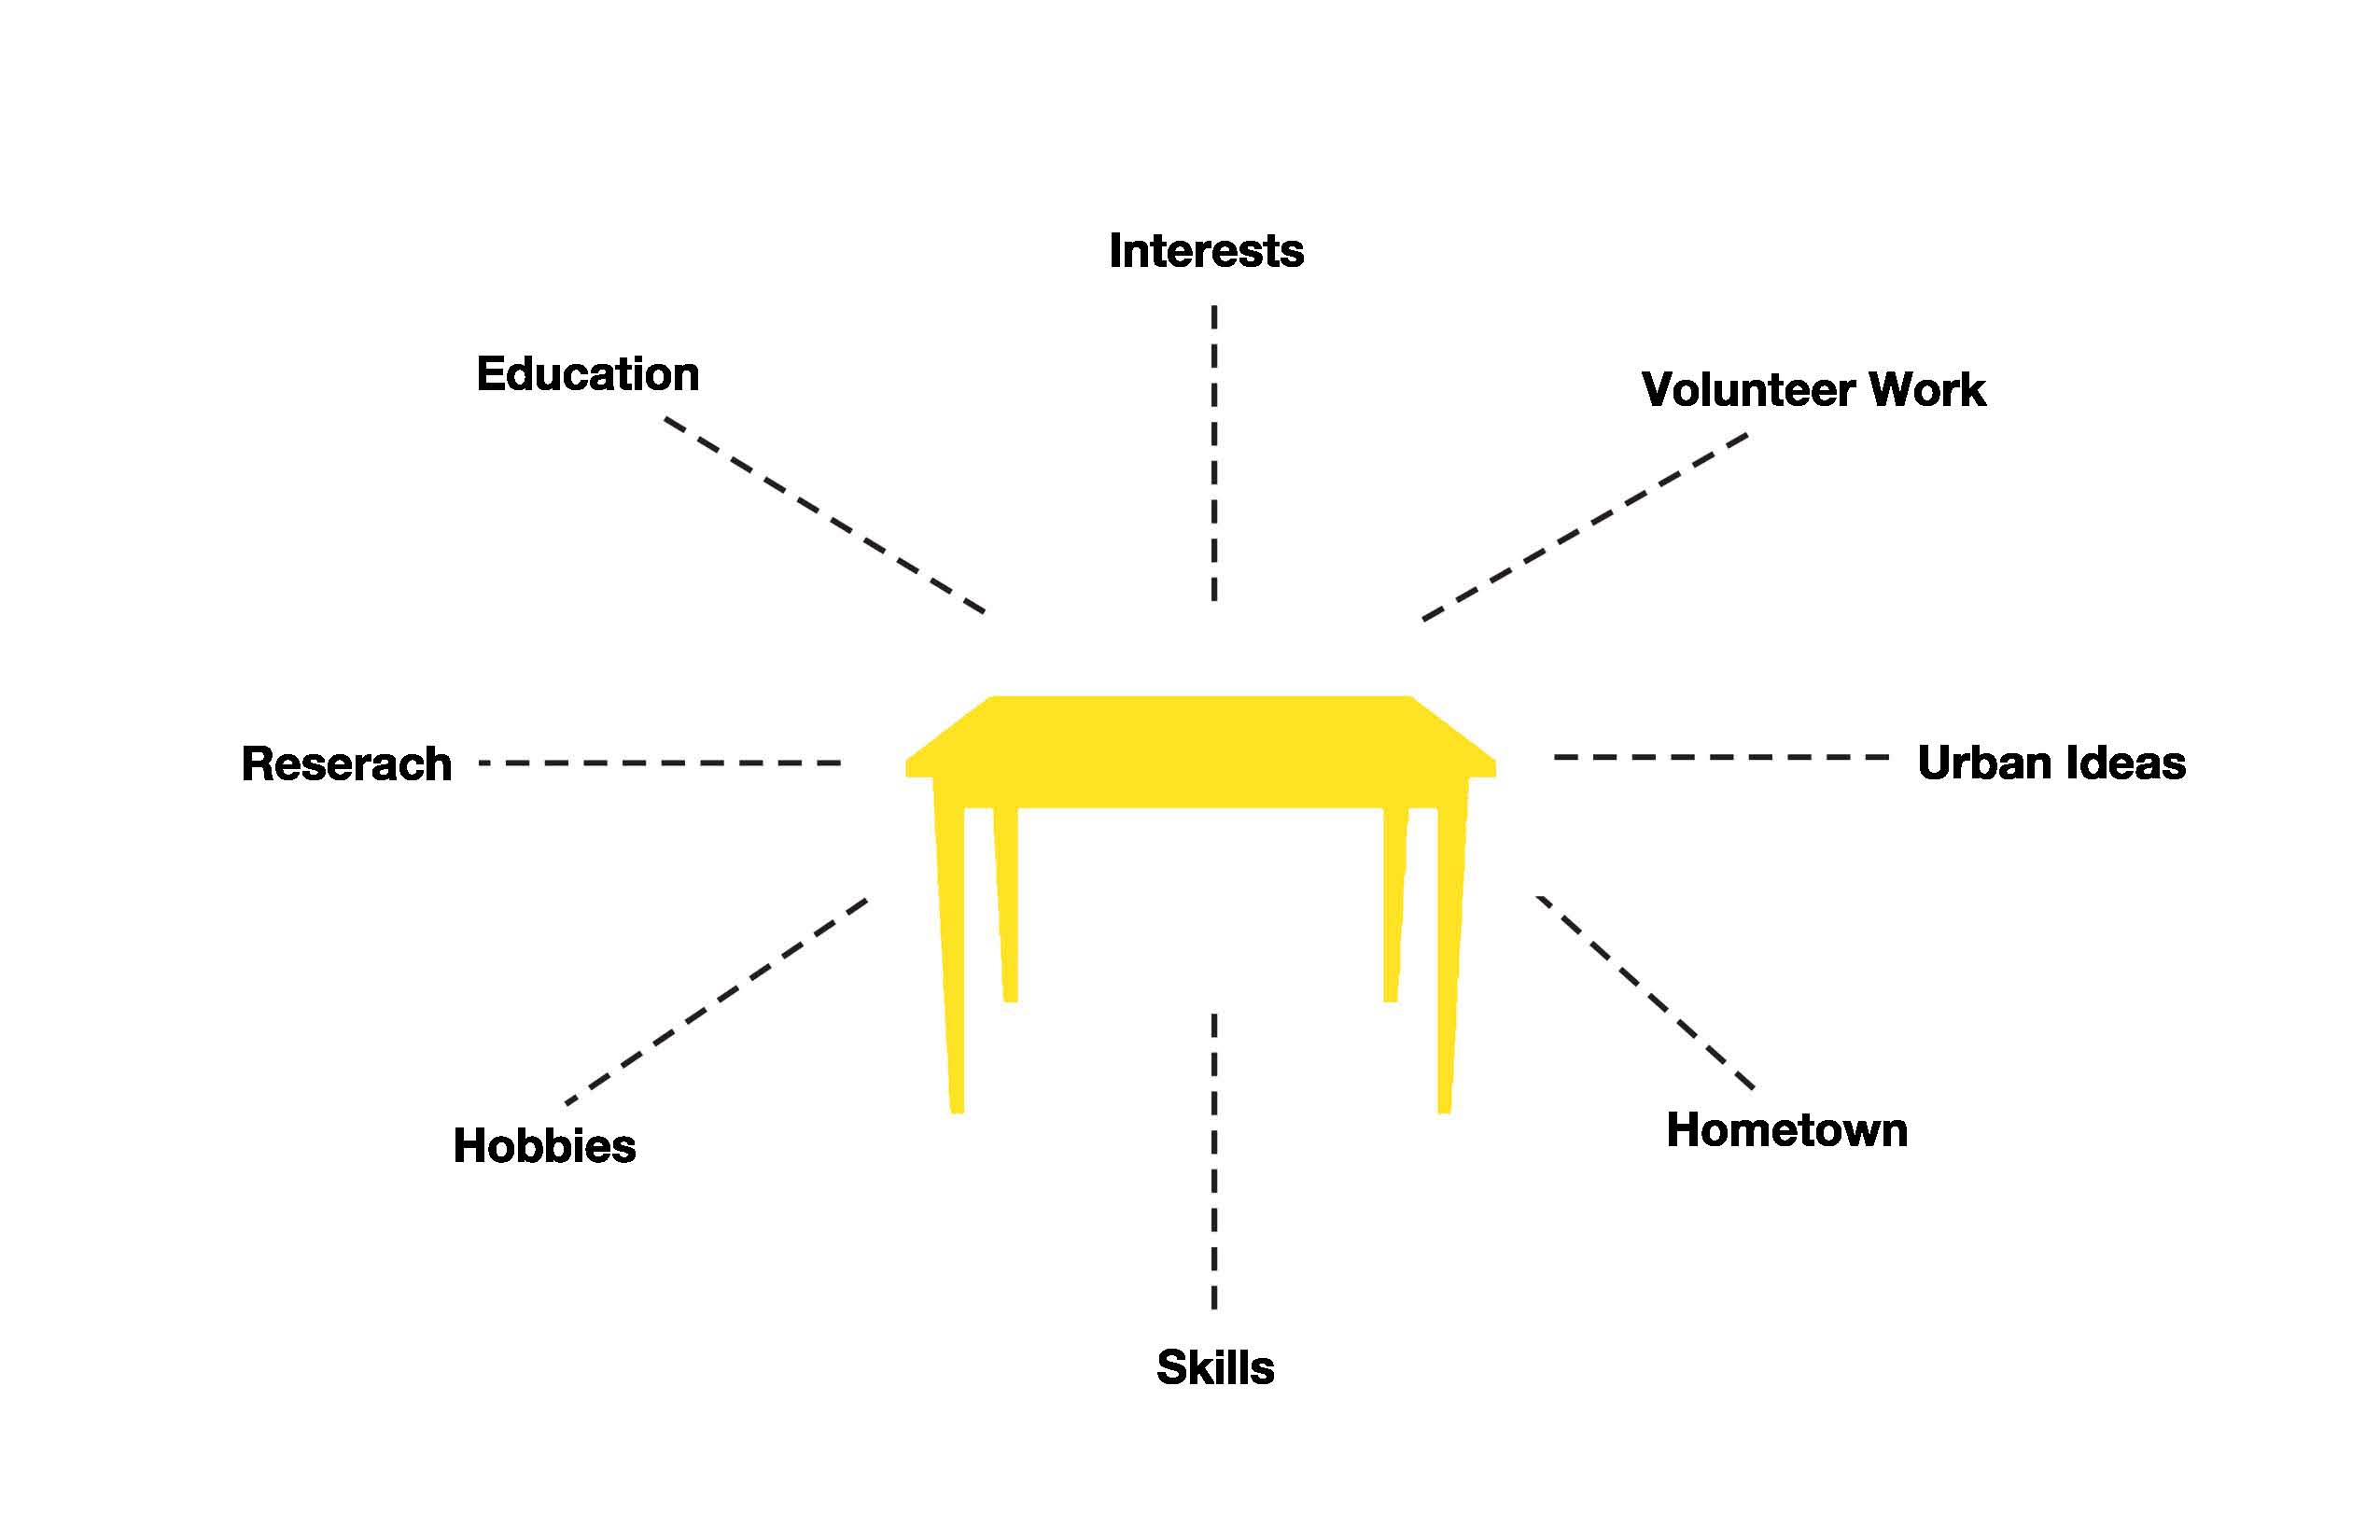
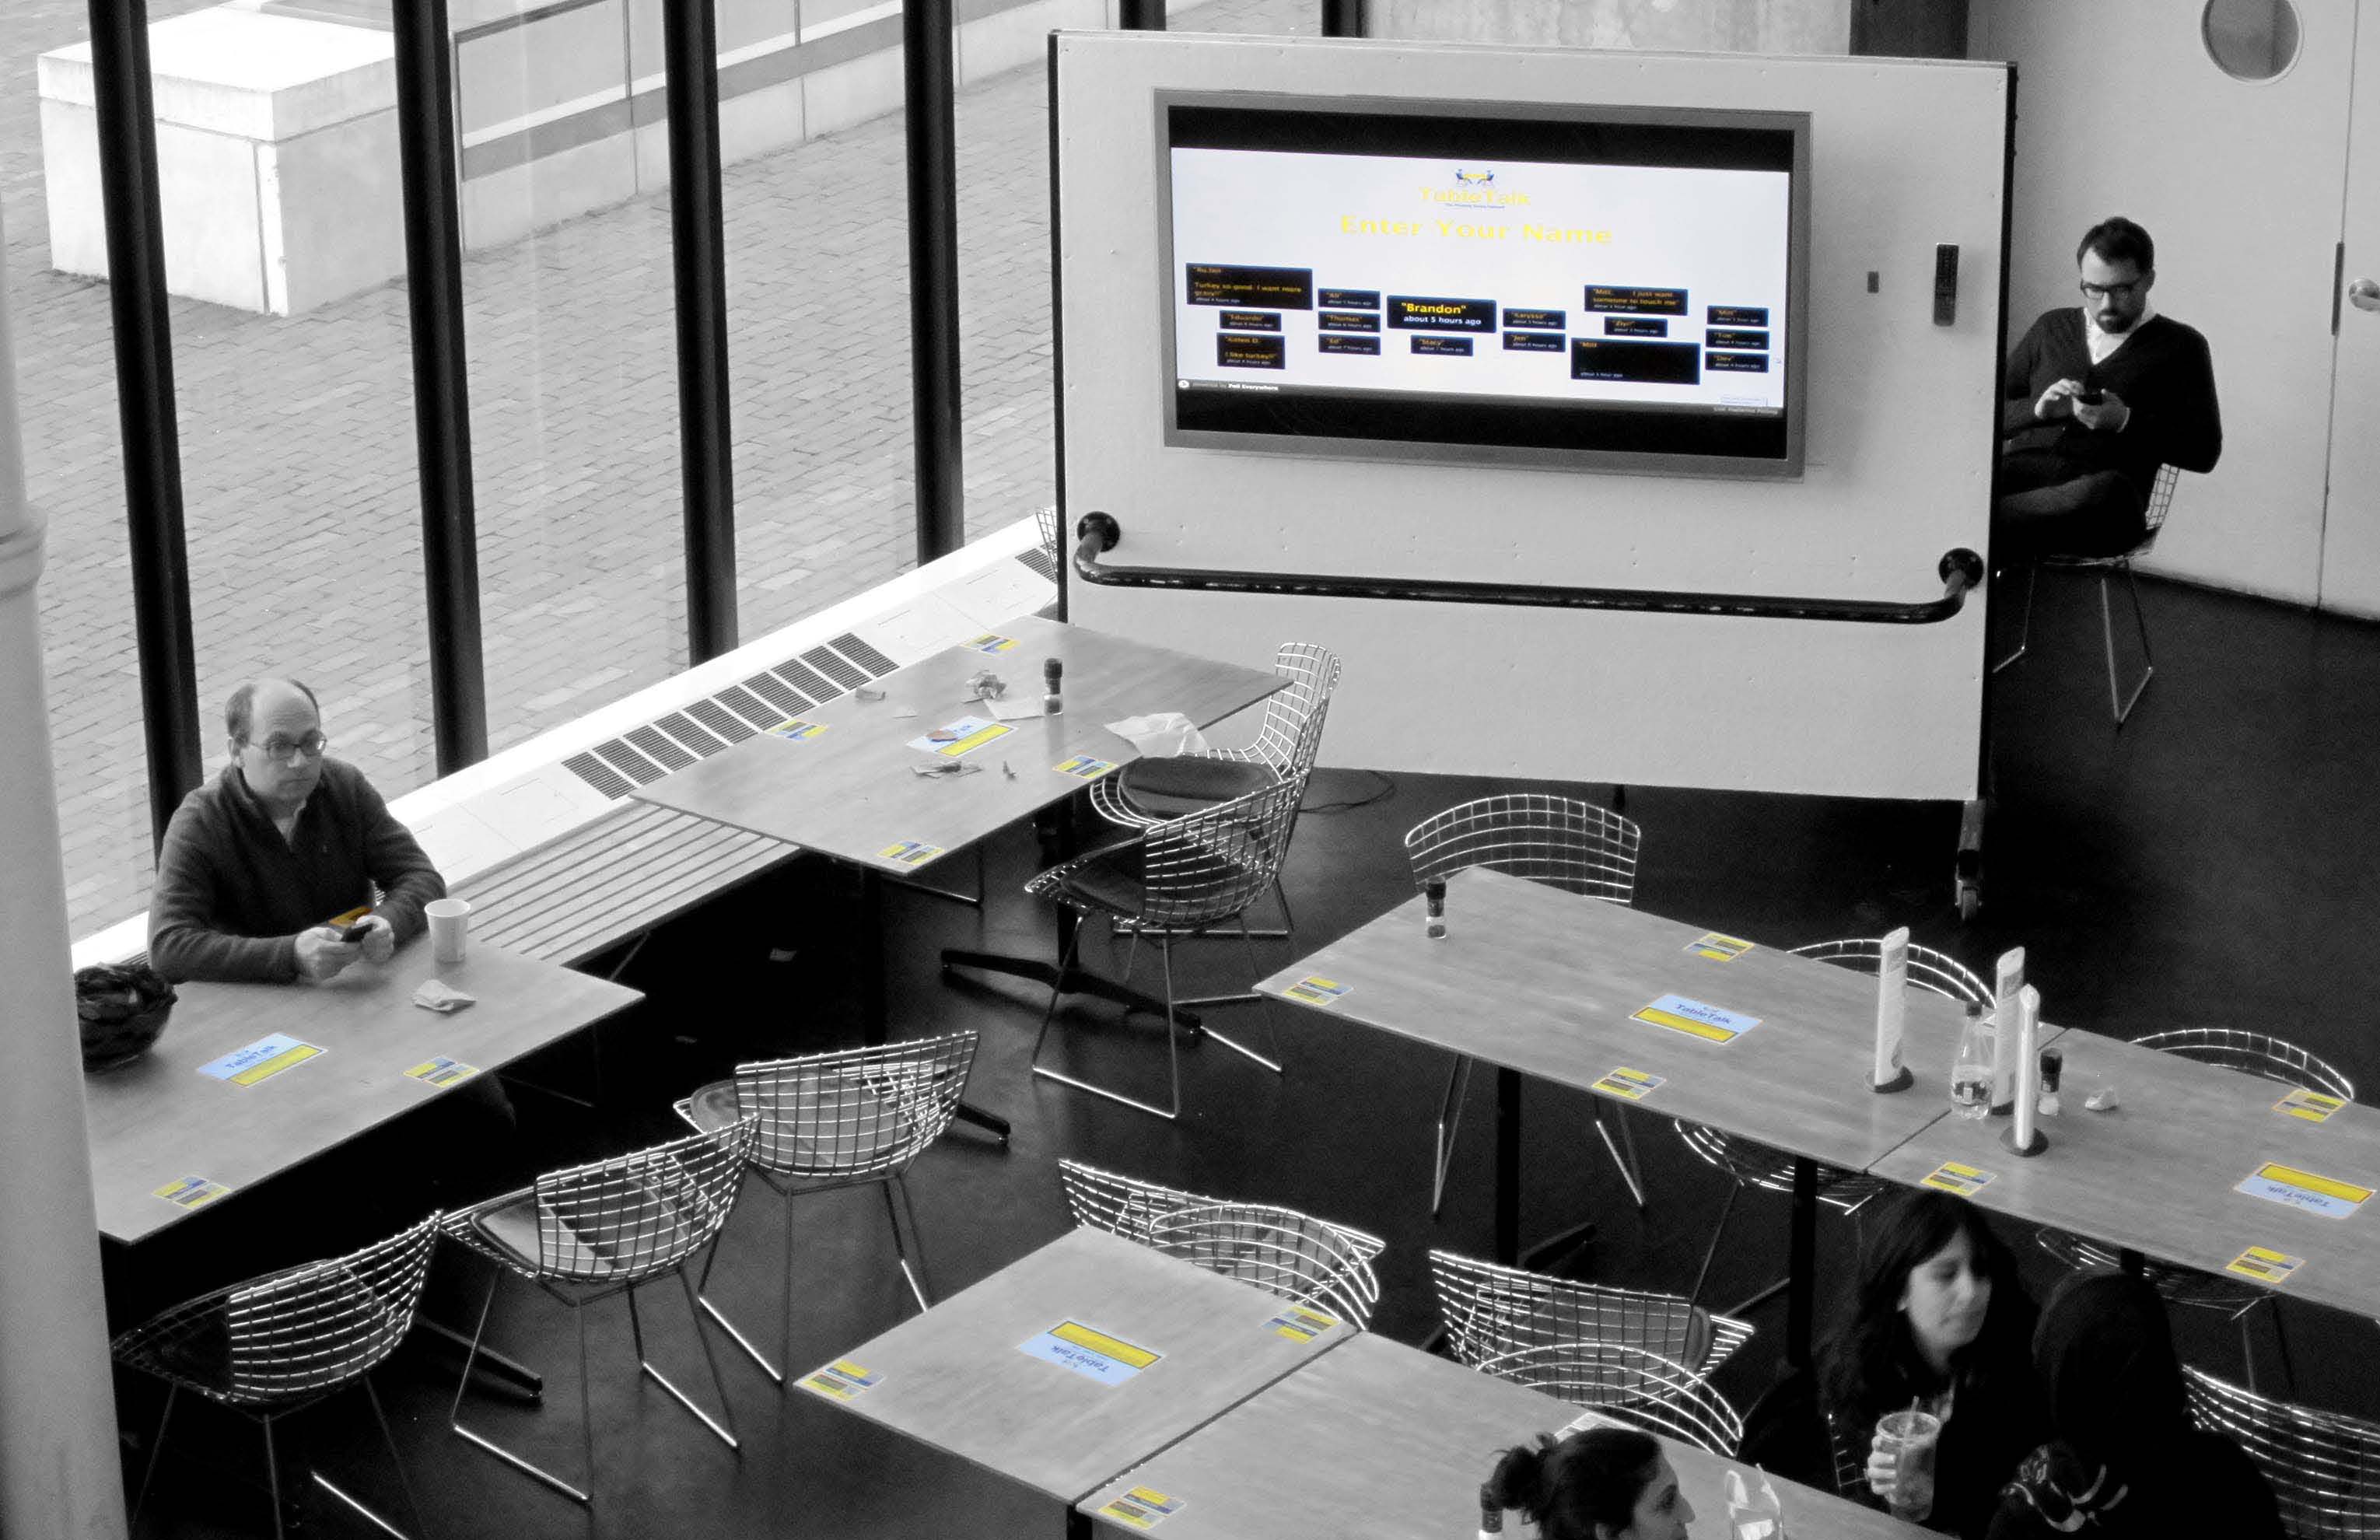
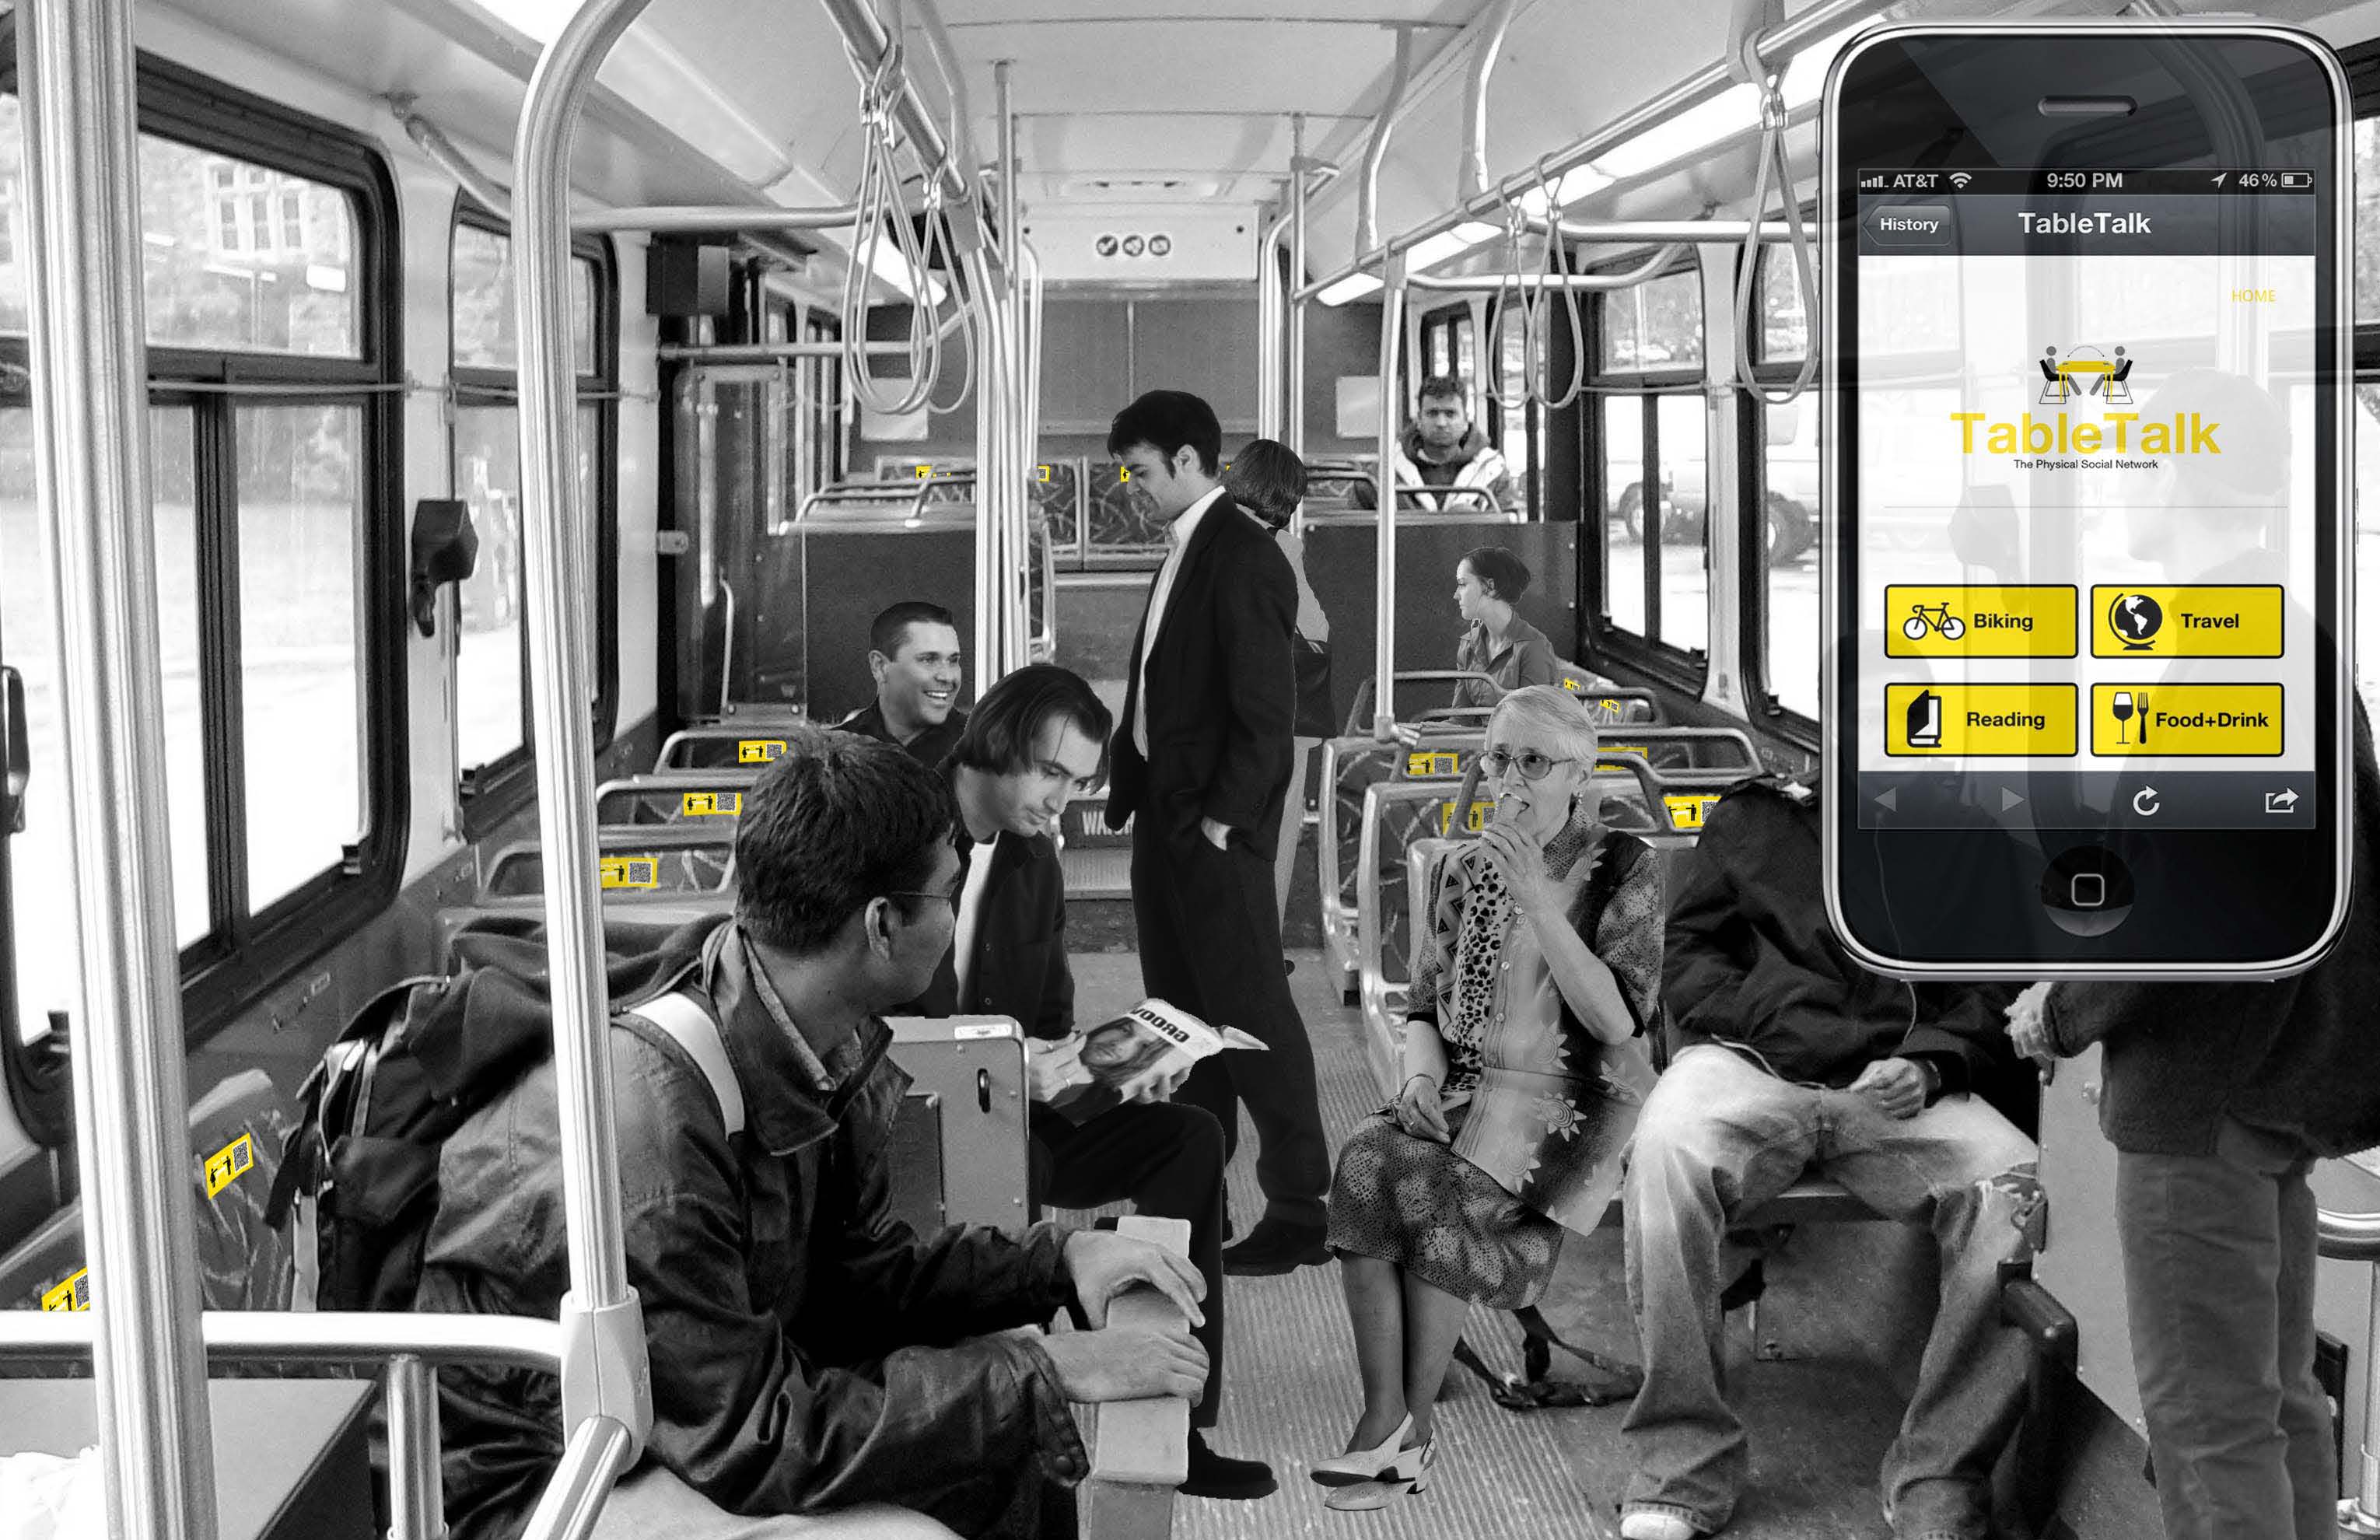
Table Talk is a physical social network connecting individuals of like interests by combining the physical and digital realms of urban space. This new community typology makes formerly invisible layers of shared interest visible in the material space. By embedding personal metadata onto physical objects, a new community work space is developed connecting individuals in both real time and to past occupants; highlighting the importance of the city as place.
Looking at the history of social networking, social connections first and foremost were always spatial. With the invention of the internet, social interaction went from physical to digital and new geo-location technology begins to bring the physical back into social networking, yet only as a dot on a map. What if instead of separating our physical and virtual layers, there was a way our physical environment could become a social network?

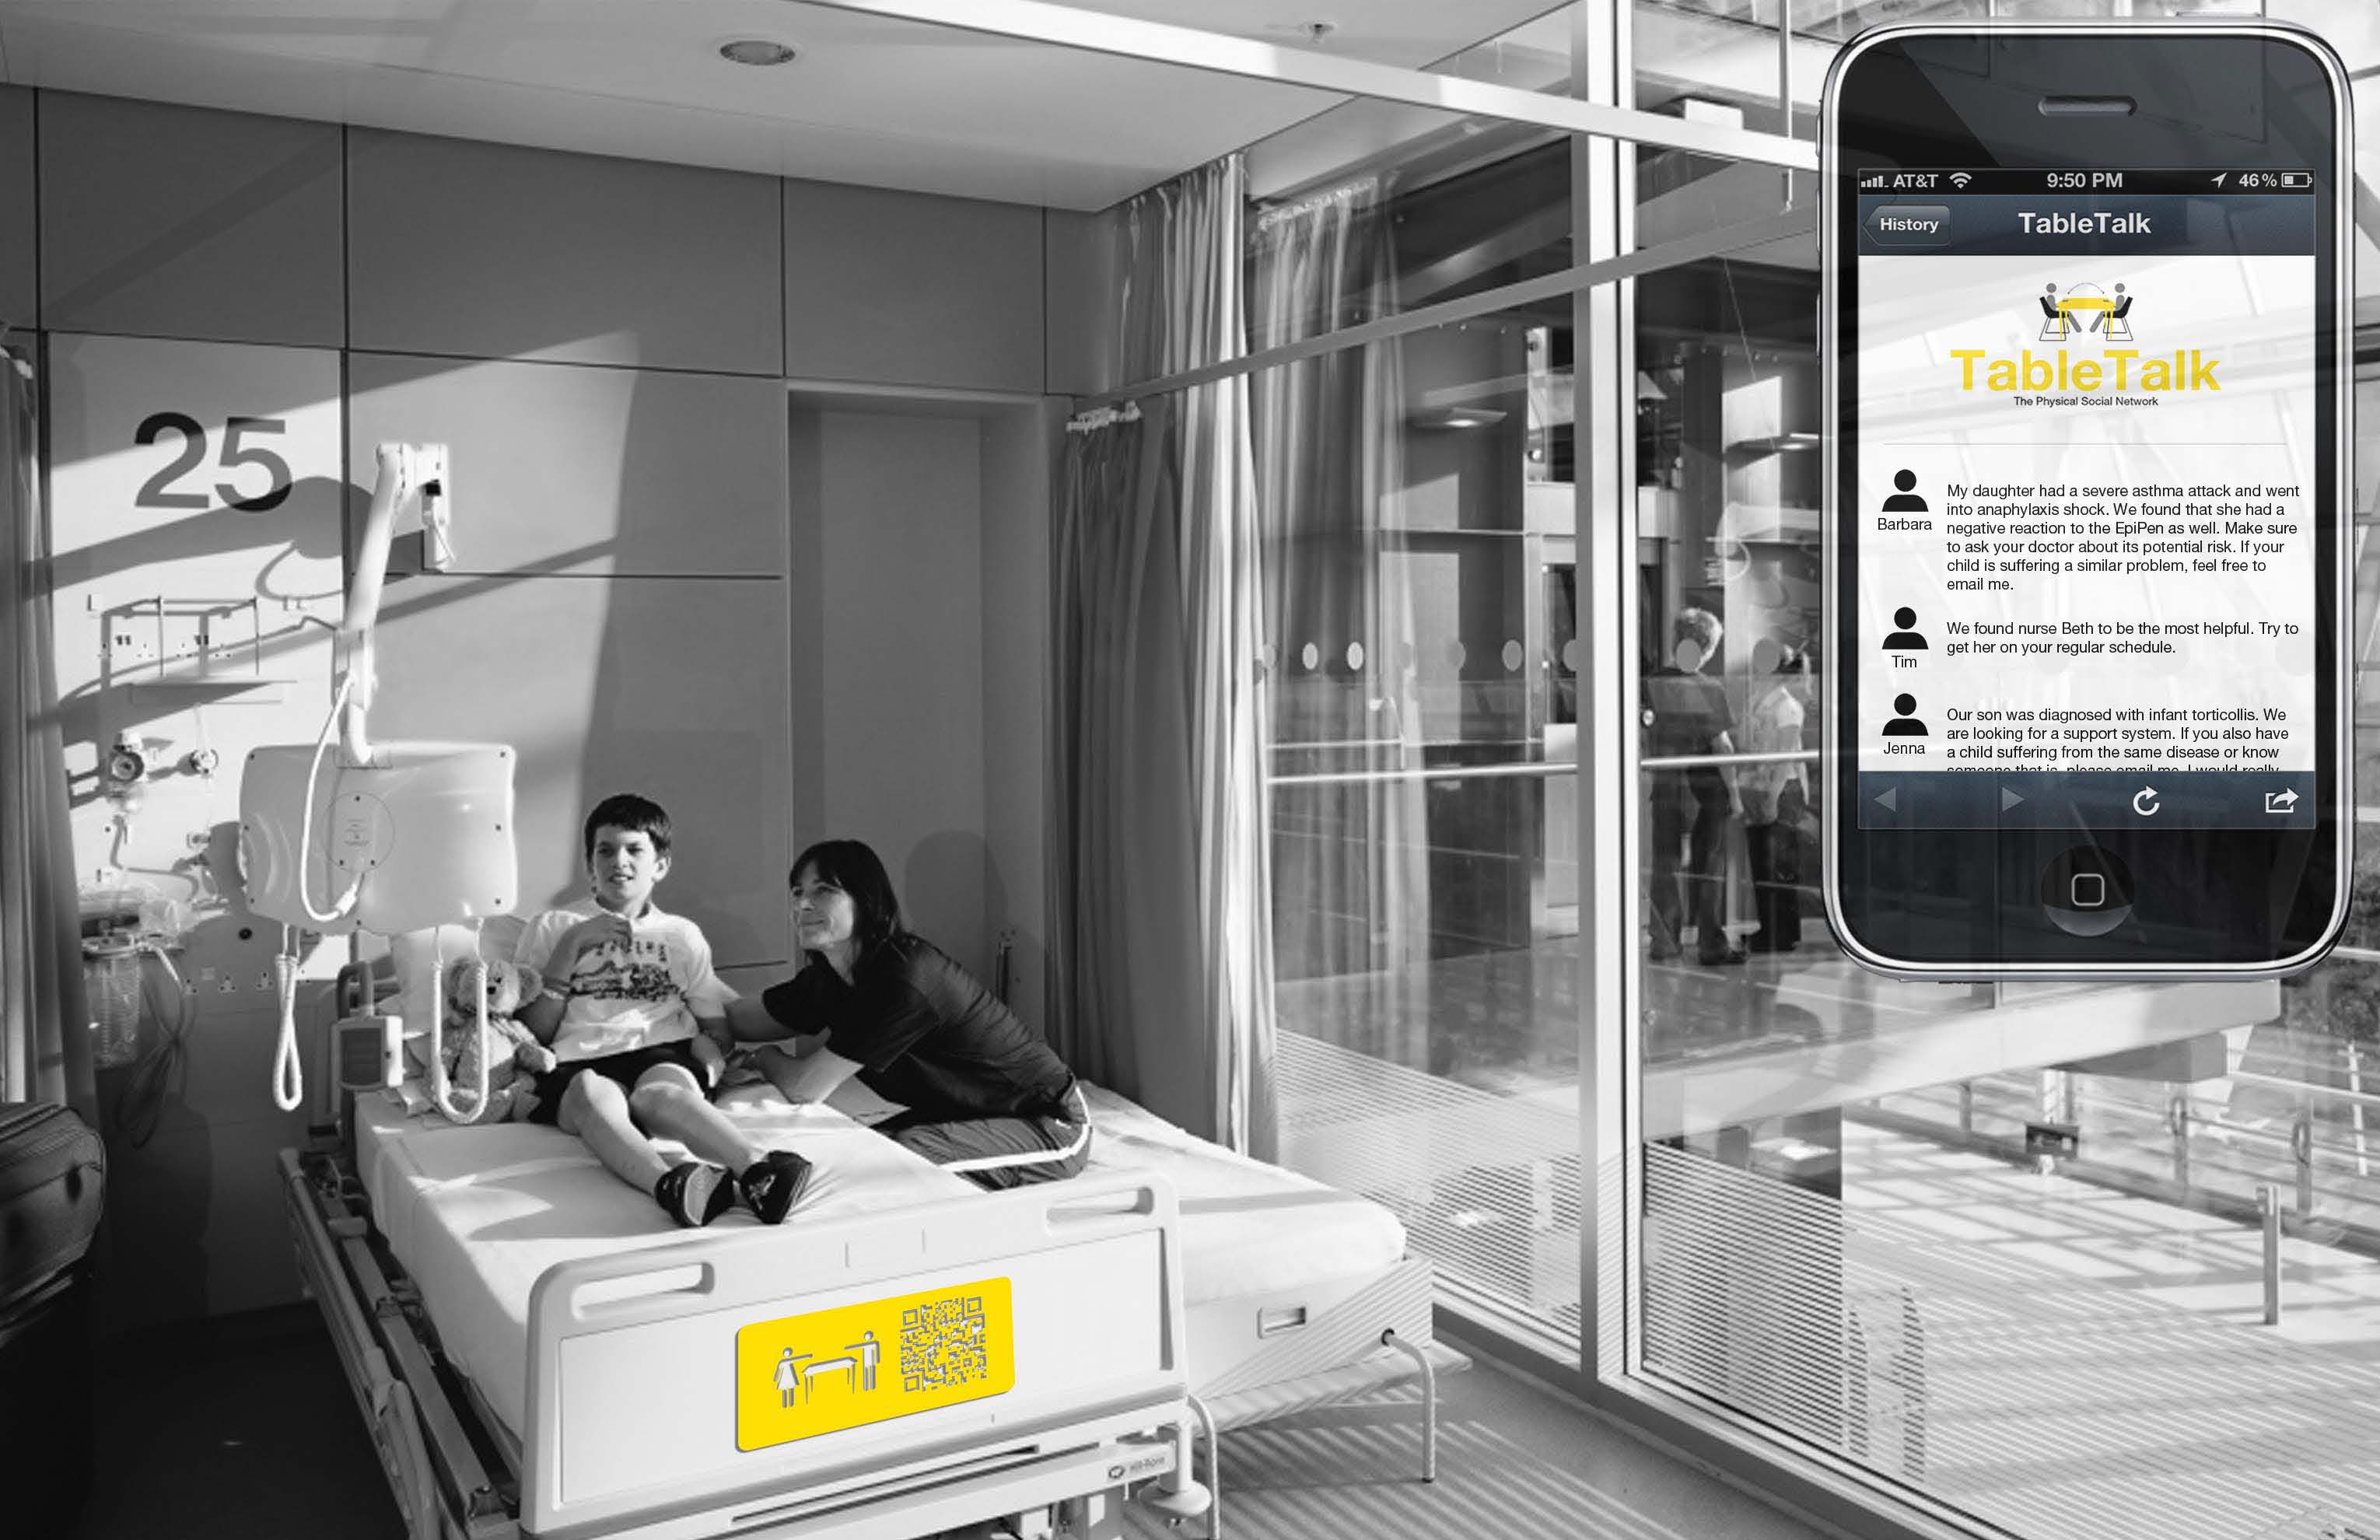
TableTalk is the exploration of the static object with an overlaid layer of digital technology which allows the user to embed personal metadata. Each table is networked into a larger system within the room. As an individual ‘engraves’ their interests onto the table; the system is able to delineate shared layers between occupants, connecting people in real time. Once the table receives an individual’s interests, it retains a trace of that person so that connections can occur across temporalities. Based on chance occurrence of choosing the same table, individuals of shared interests can connect through the physical environment. People can leave traces of themselves on the table for the past and the future; adding a heightened importance to place.
With the increased use of the ‘in between’ place between work and home where individuals come to work independently in public, TableTalk further enhances the social quality of this space. This new typology is a place to work alongside other intellectuals, some of which may share an inherent knowledge base, and connect on mutually beneficial terms. This type of environment not only provides a work space, but starts to break social barriers through place, creating a richer way for people to connect, develop community, provide place for organizing and therefore become a tool for place making.

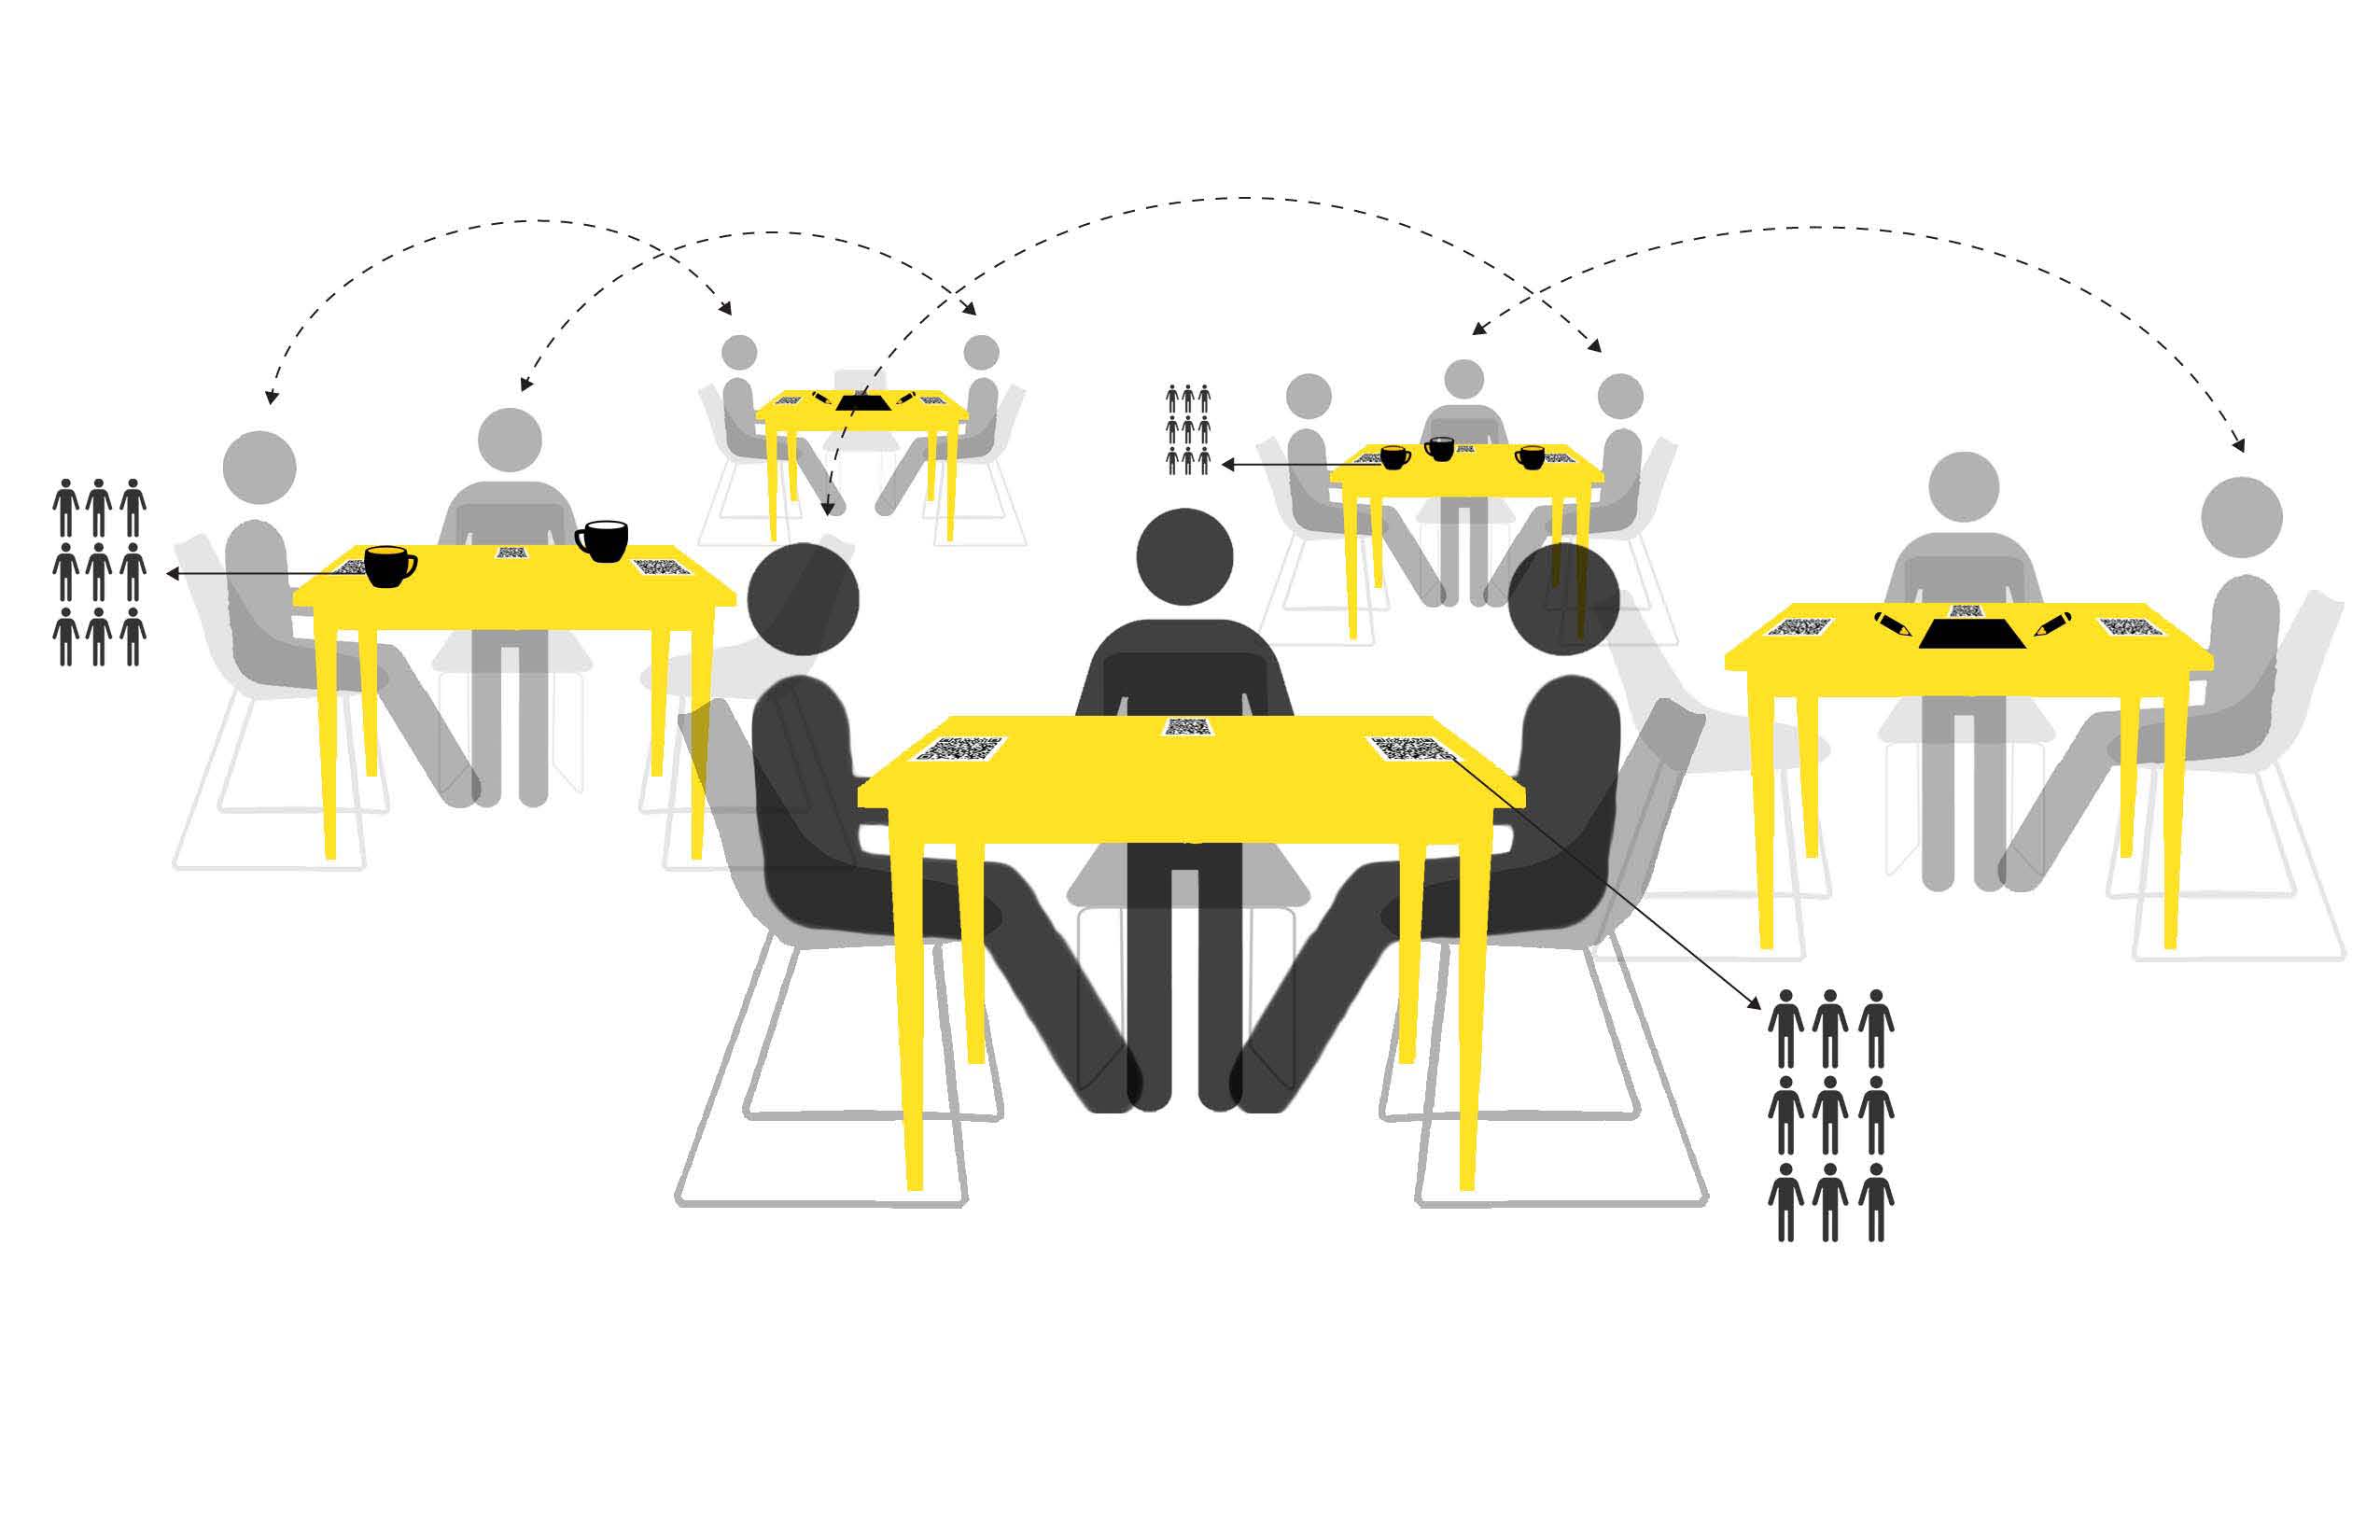
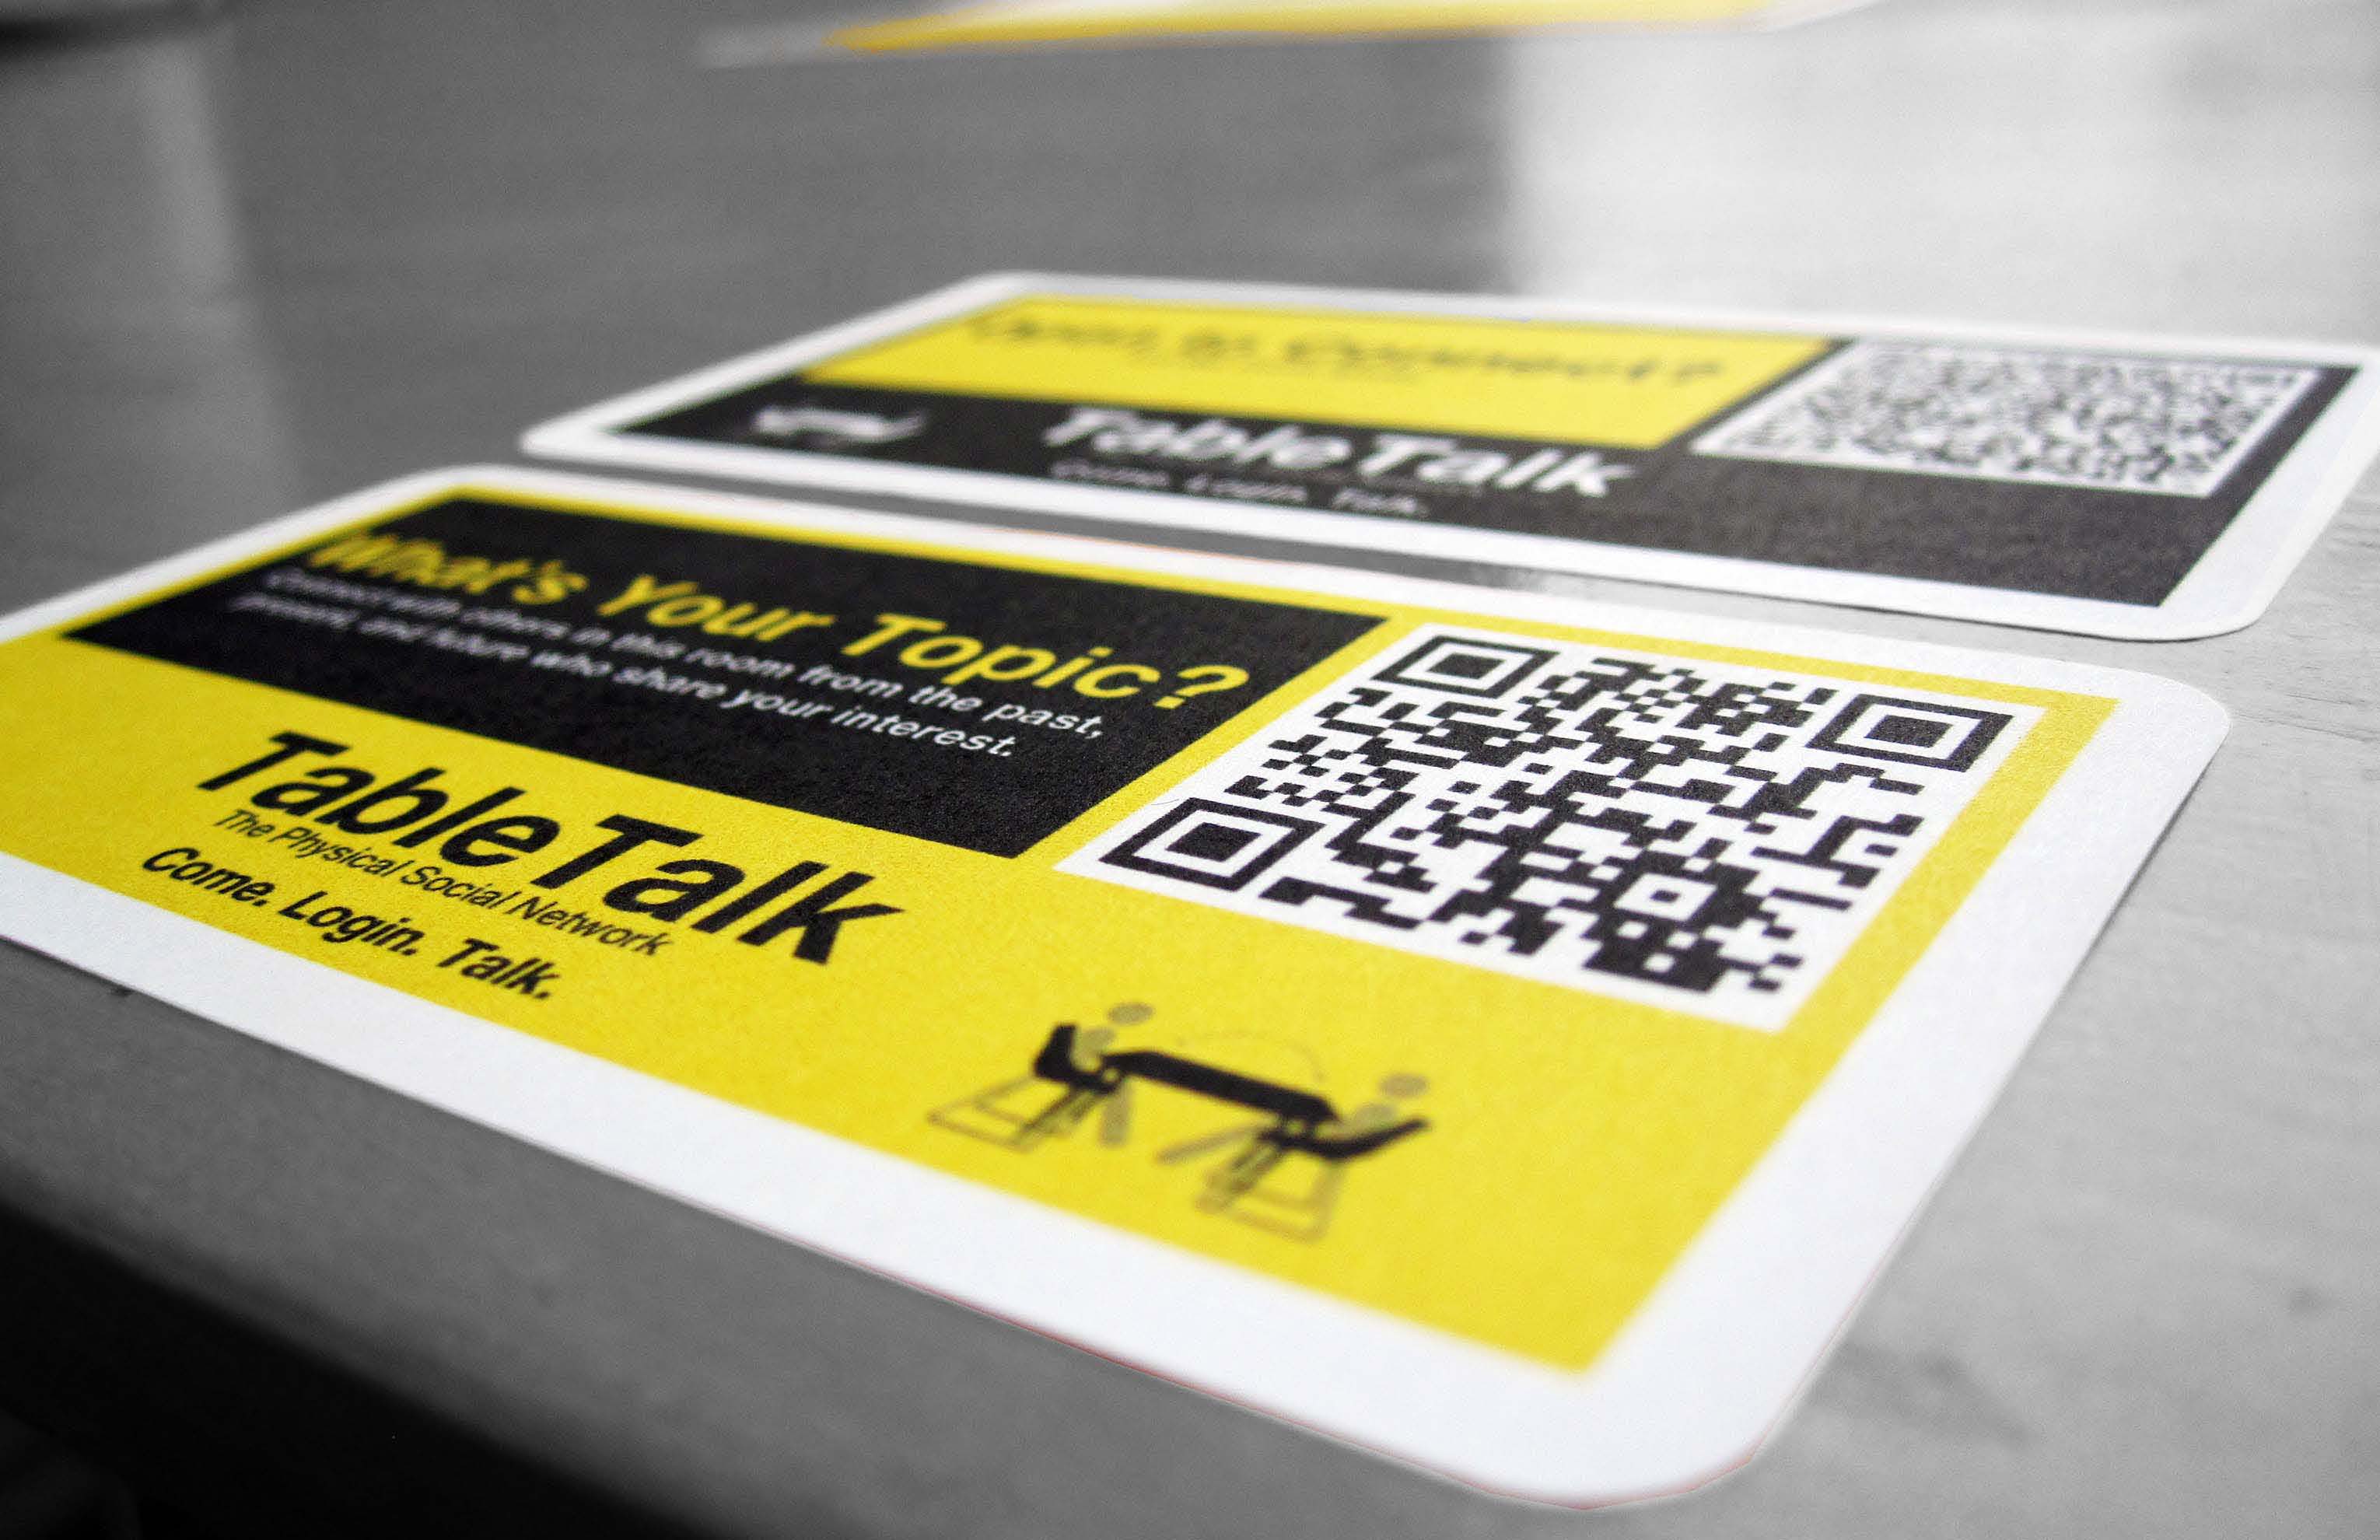
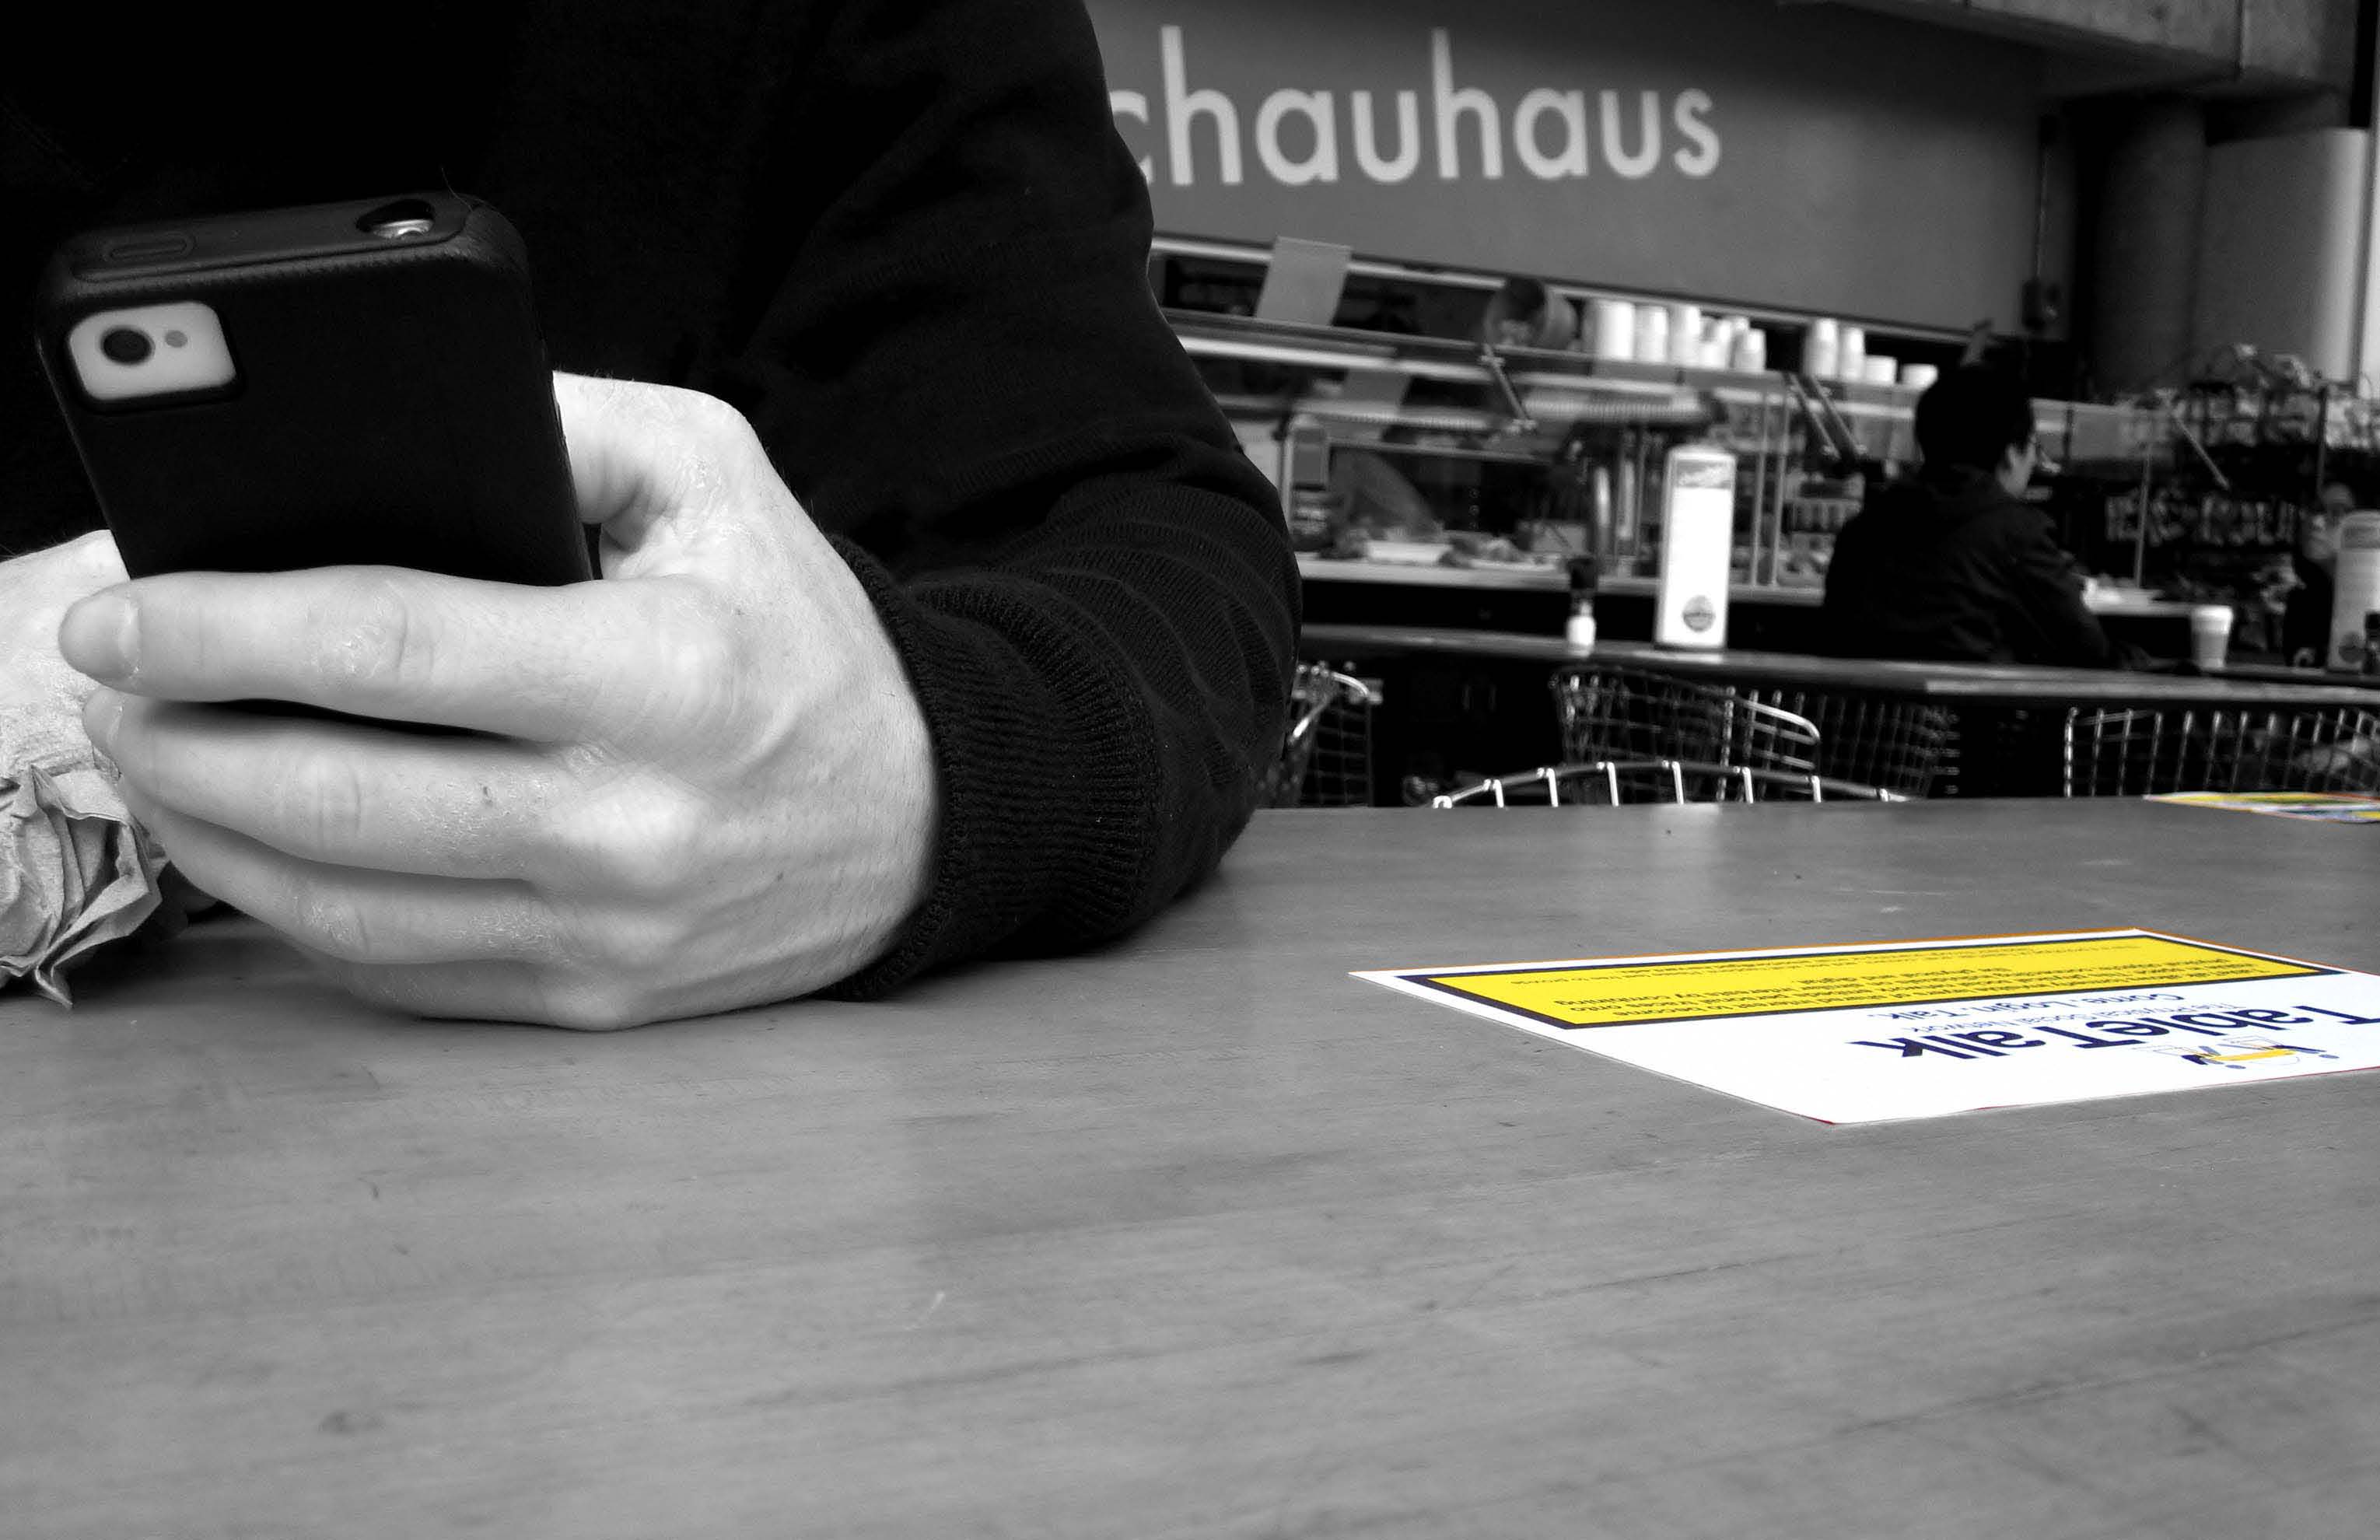
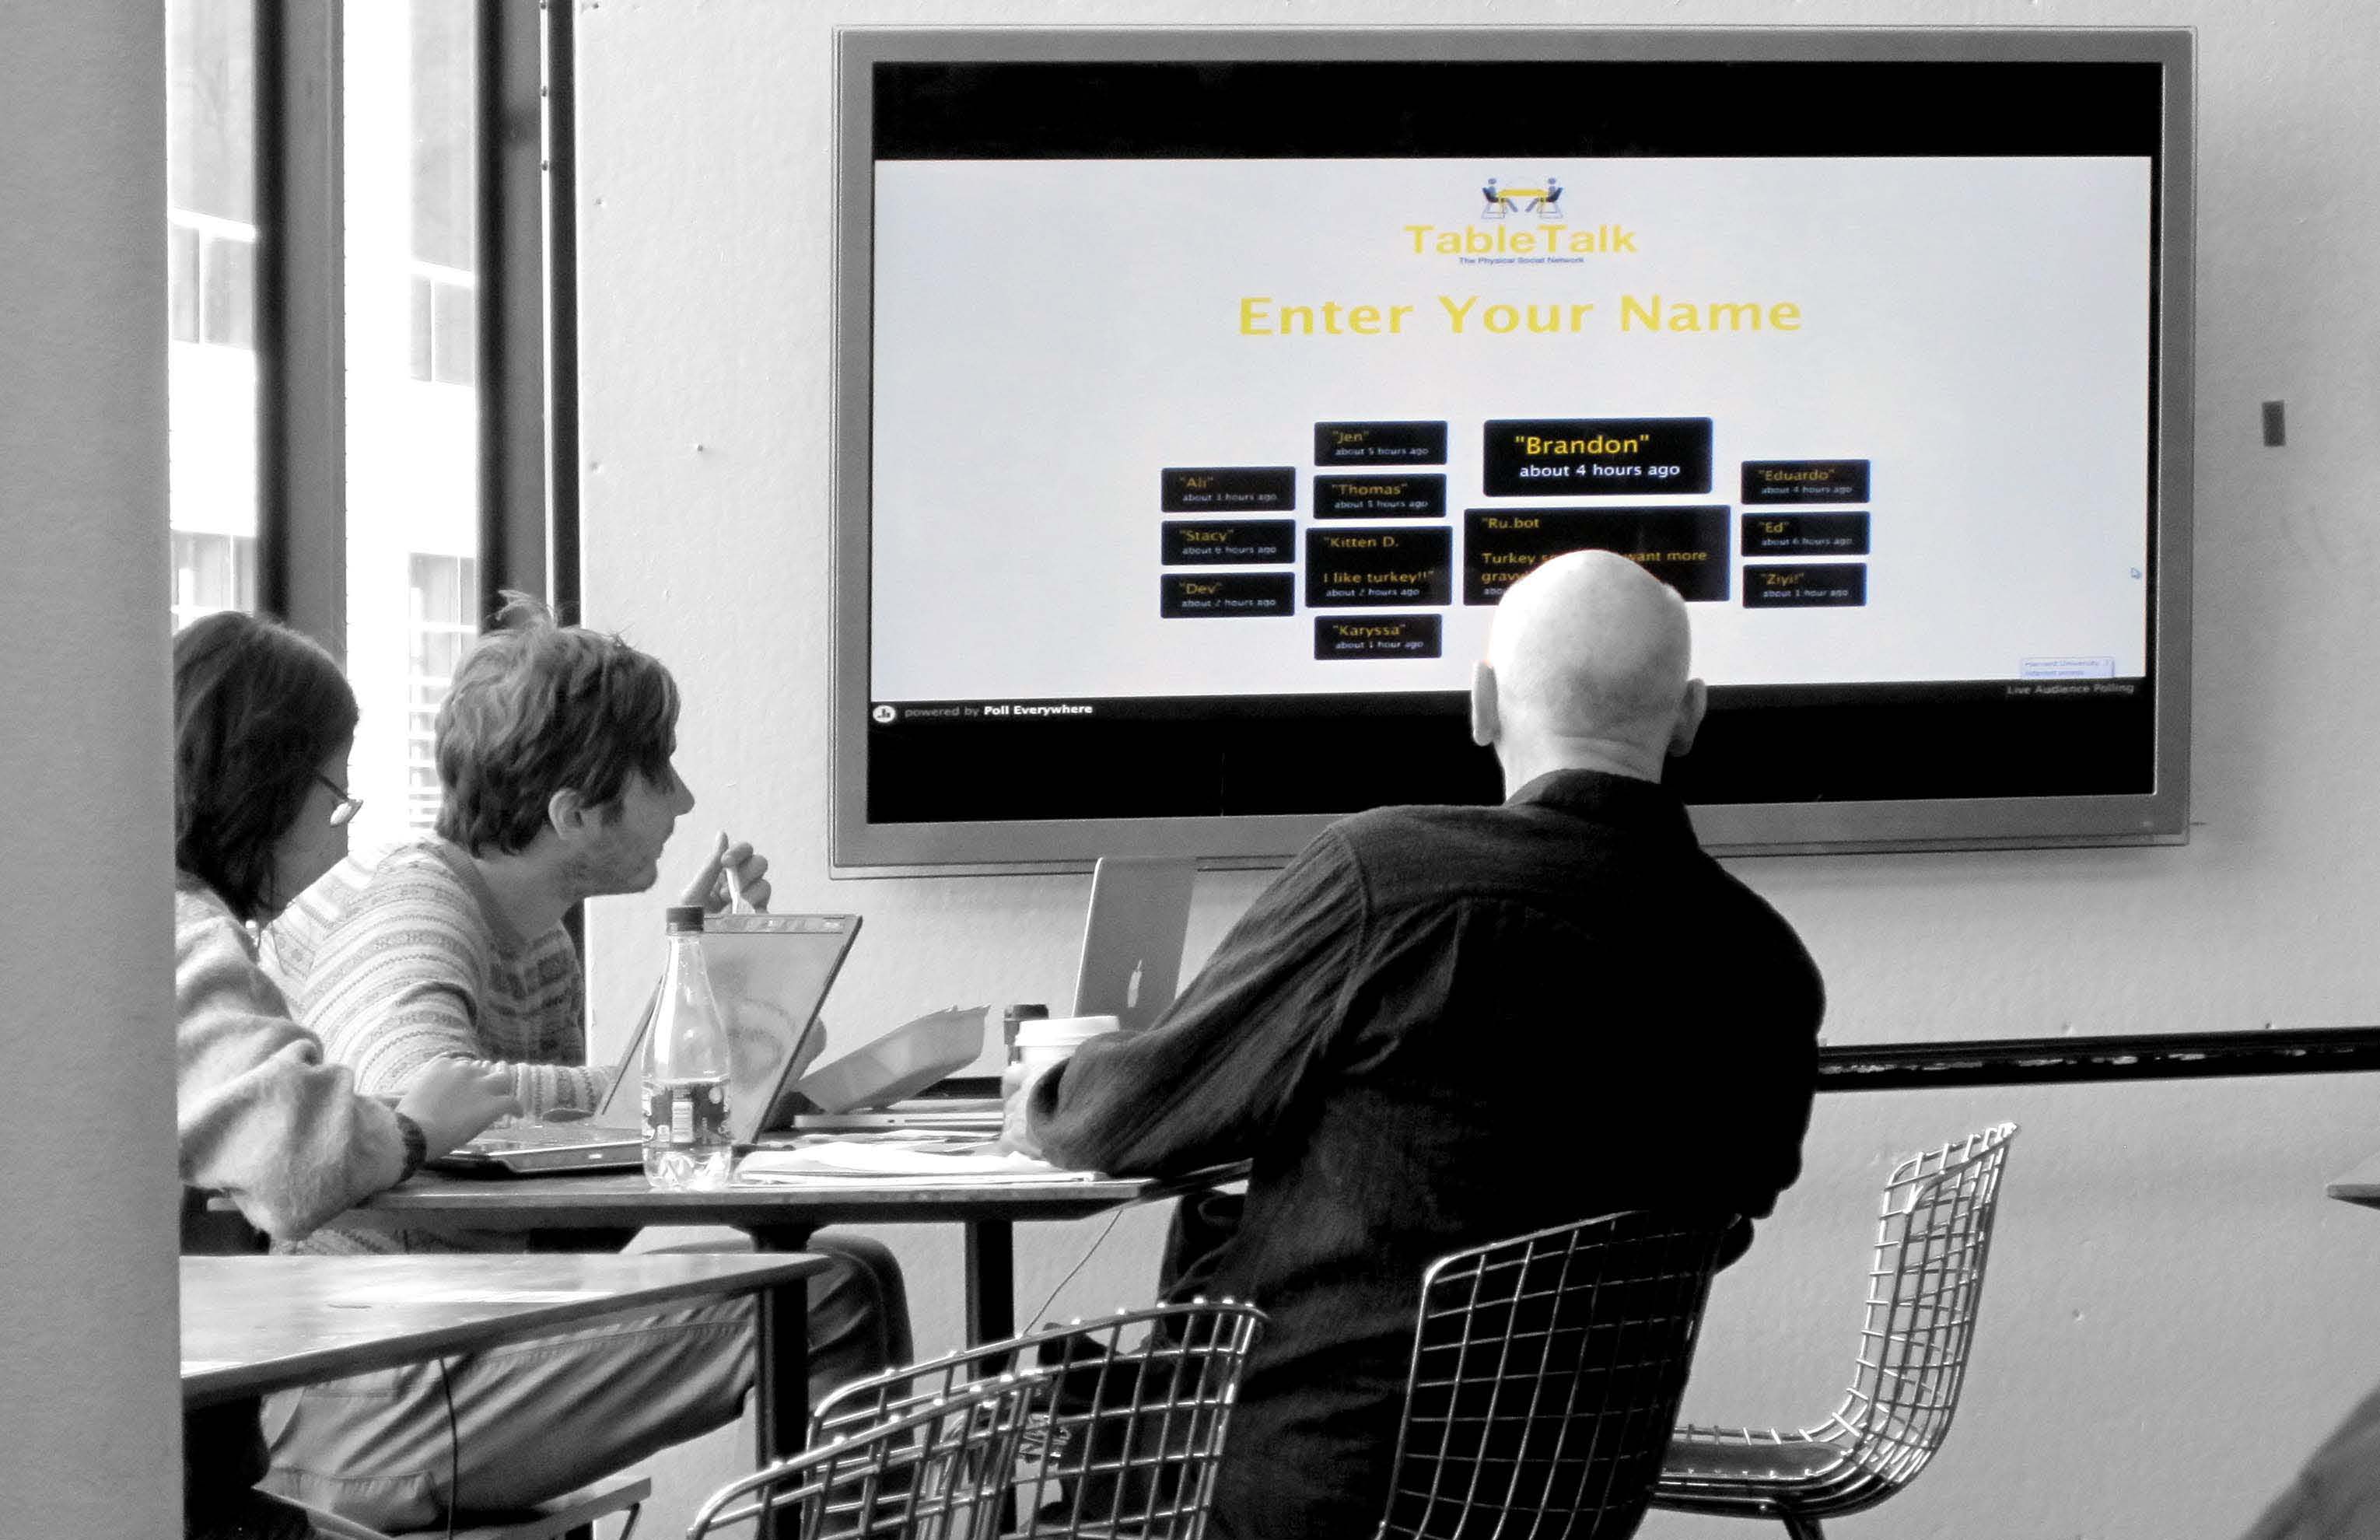
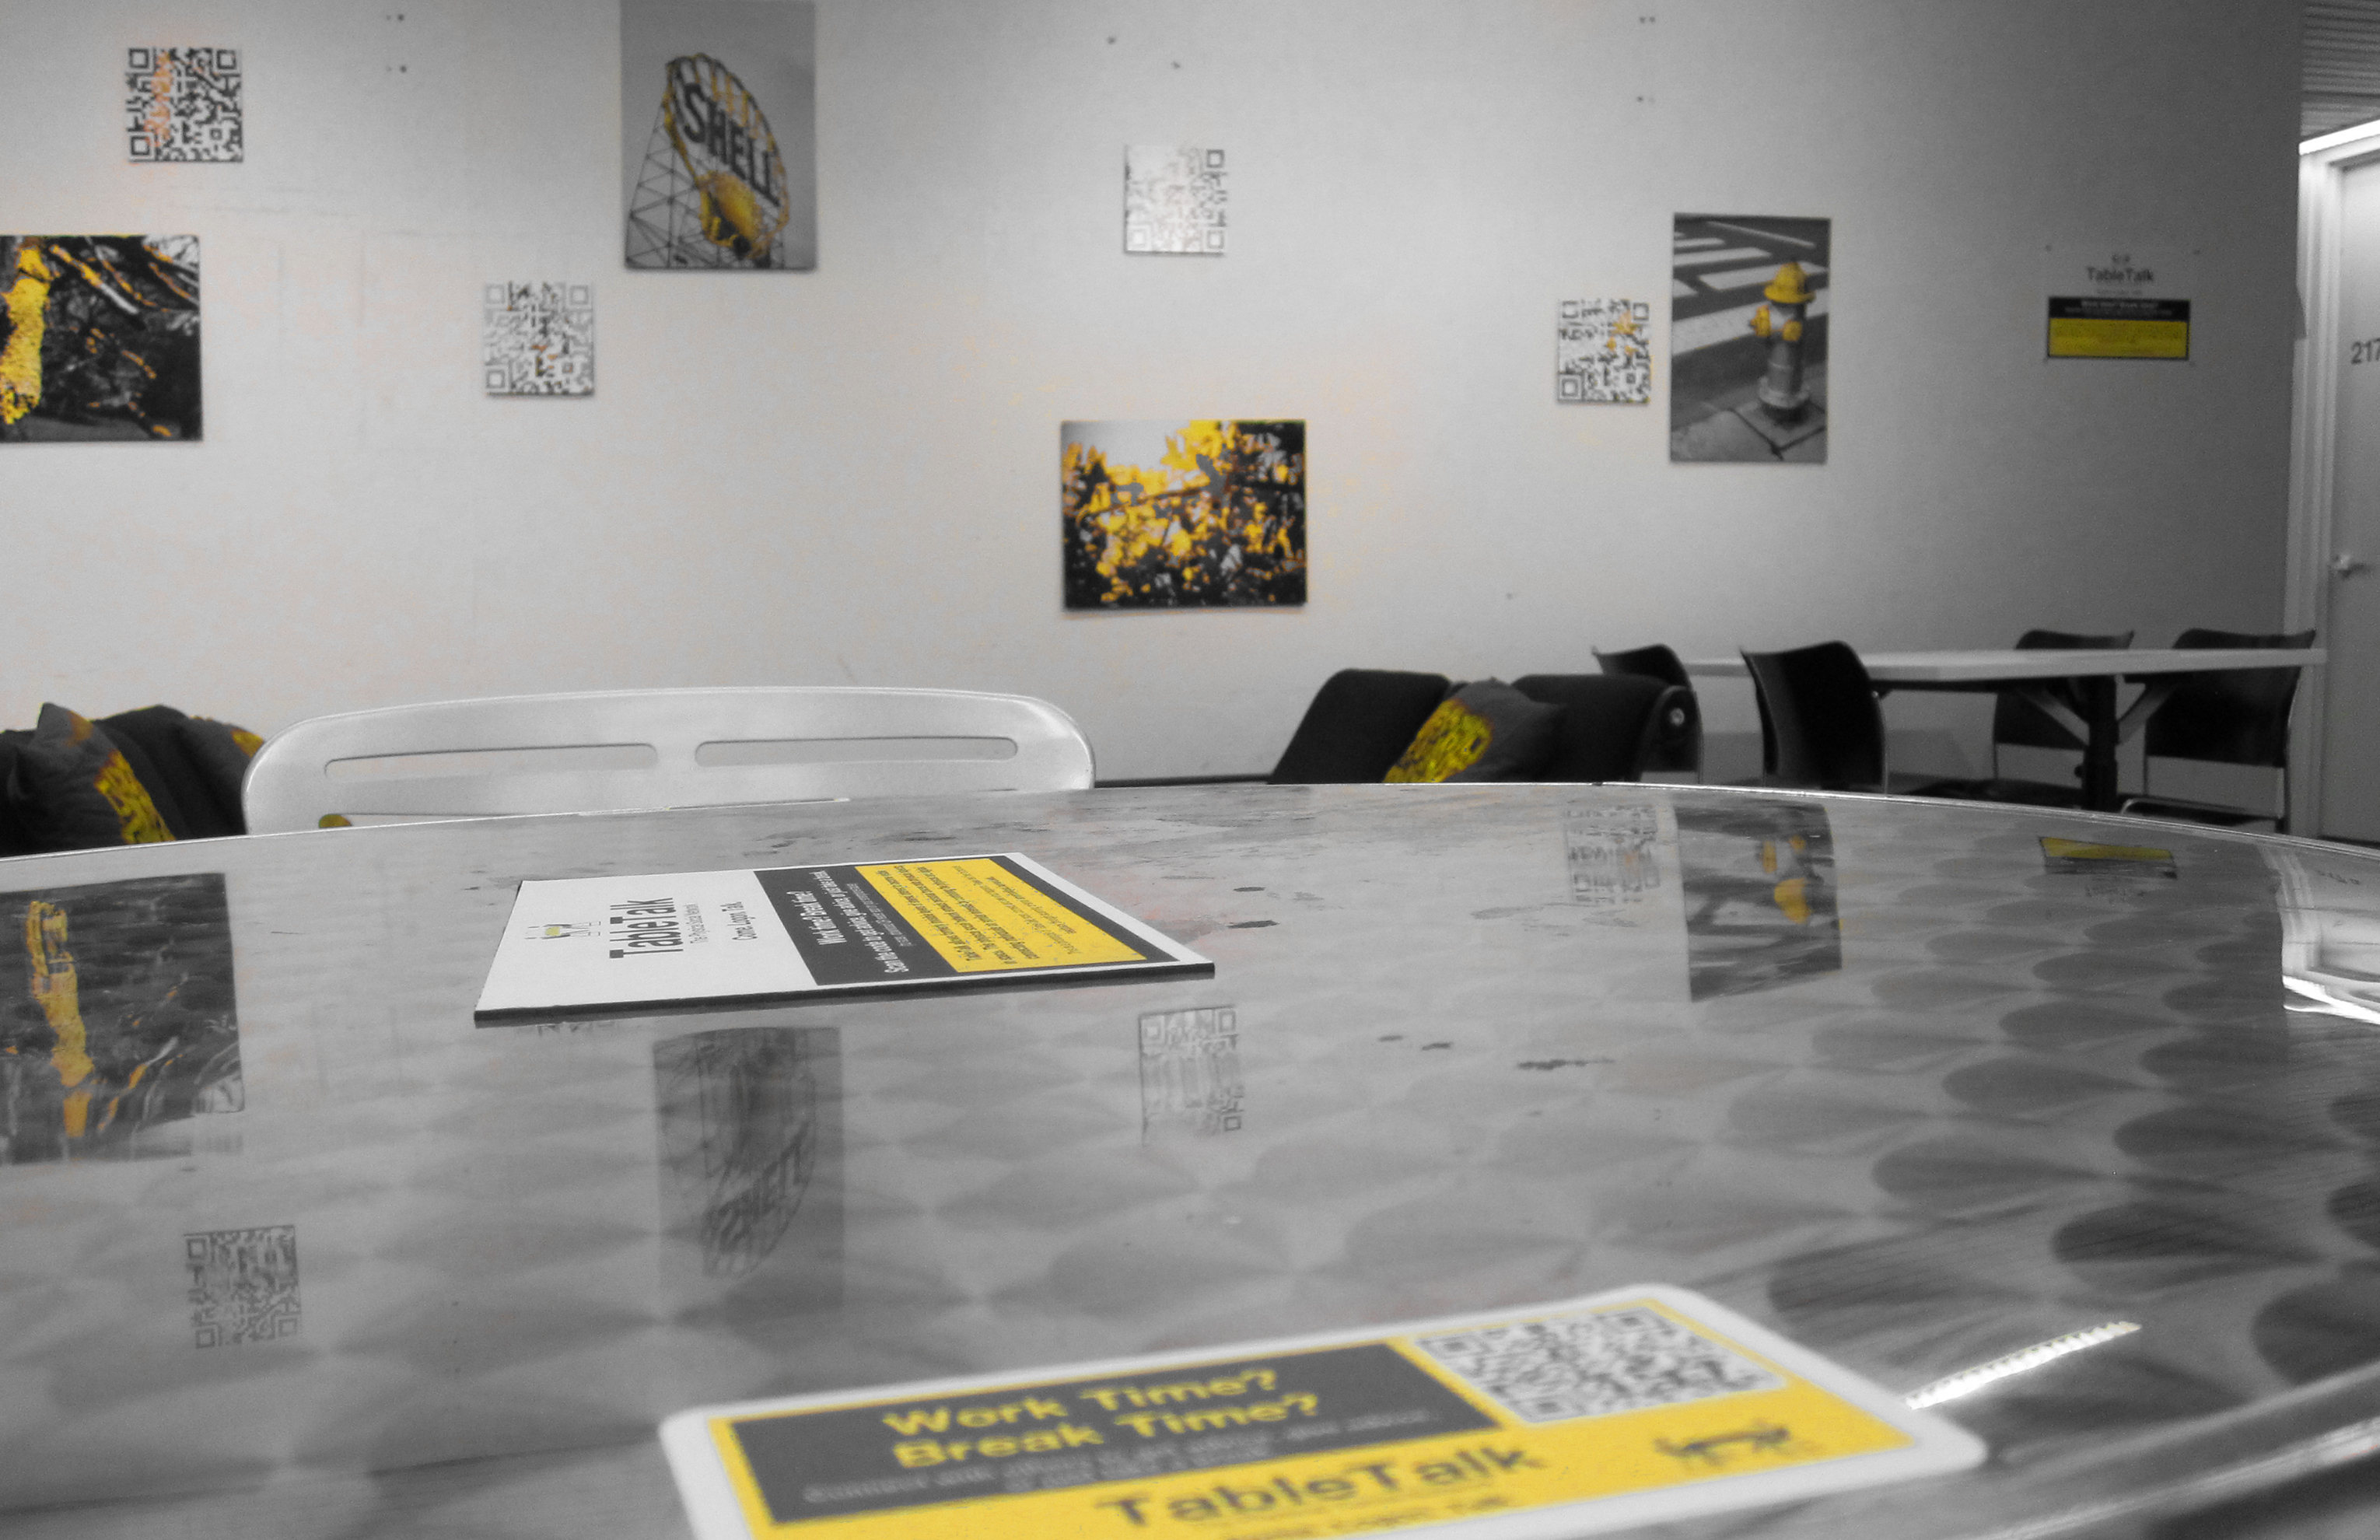
There are several approaches to implementing this physical social network; each incorporating a different level of technology; the first being the simplest means as an overlay onto an existing space. Using QR code stickers, a physical space can be advanced by simply overlaying a digital layer onto its existing surface. The individual can then scan the QR code using their phone and input their layers of interest to begin to connect with others in that space. The first implementation of TableTalk was an overlay in the cafeteria of Harvard’s Graduate School of Design. When a user scanned one of two QR codes on the table, they were prompted to choose one of four topics which brought them to an online message board to reply to past users or leave notes for future. The second QR code let the user leave a visible trace of themselves in the room. When this code was scanned, the user was prompted to enter his or her name which was then immediately displayed on a large plasma screen in the cafeteria. My initial hypothesis was that users would be more willing to use the less visible online message board rather than display their names in public; however I was surprised by the inverse results. More users publicly displayed their name rather than using the online message board. Many went on to further add comments and the screen became a show many would stop to watch. After a few days use, I discovered more messages were added to the online board; most of those in the topic ‘food & drink’; not so surprisingly being in a cafeteria. However, it makes me wonder that if this technology were located in a place without a specific program as this cafeteria had, would TableTalk be able to influence the program of a non-programmed space?


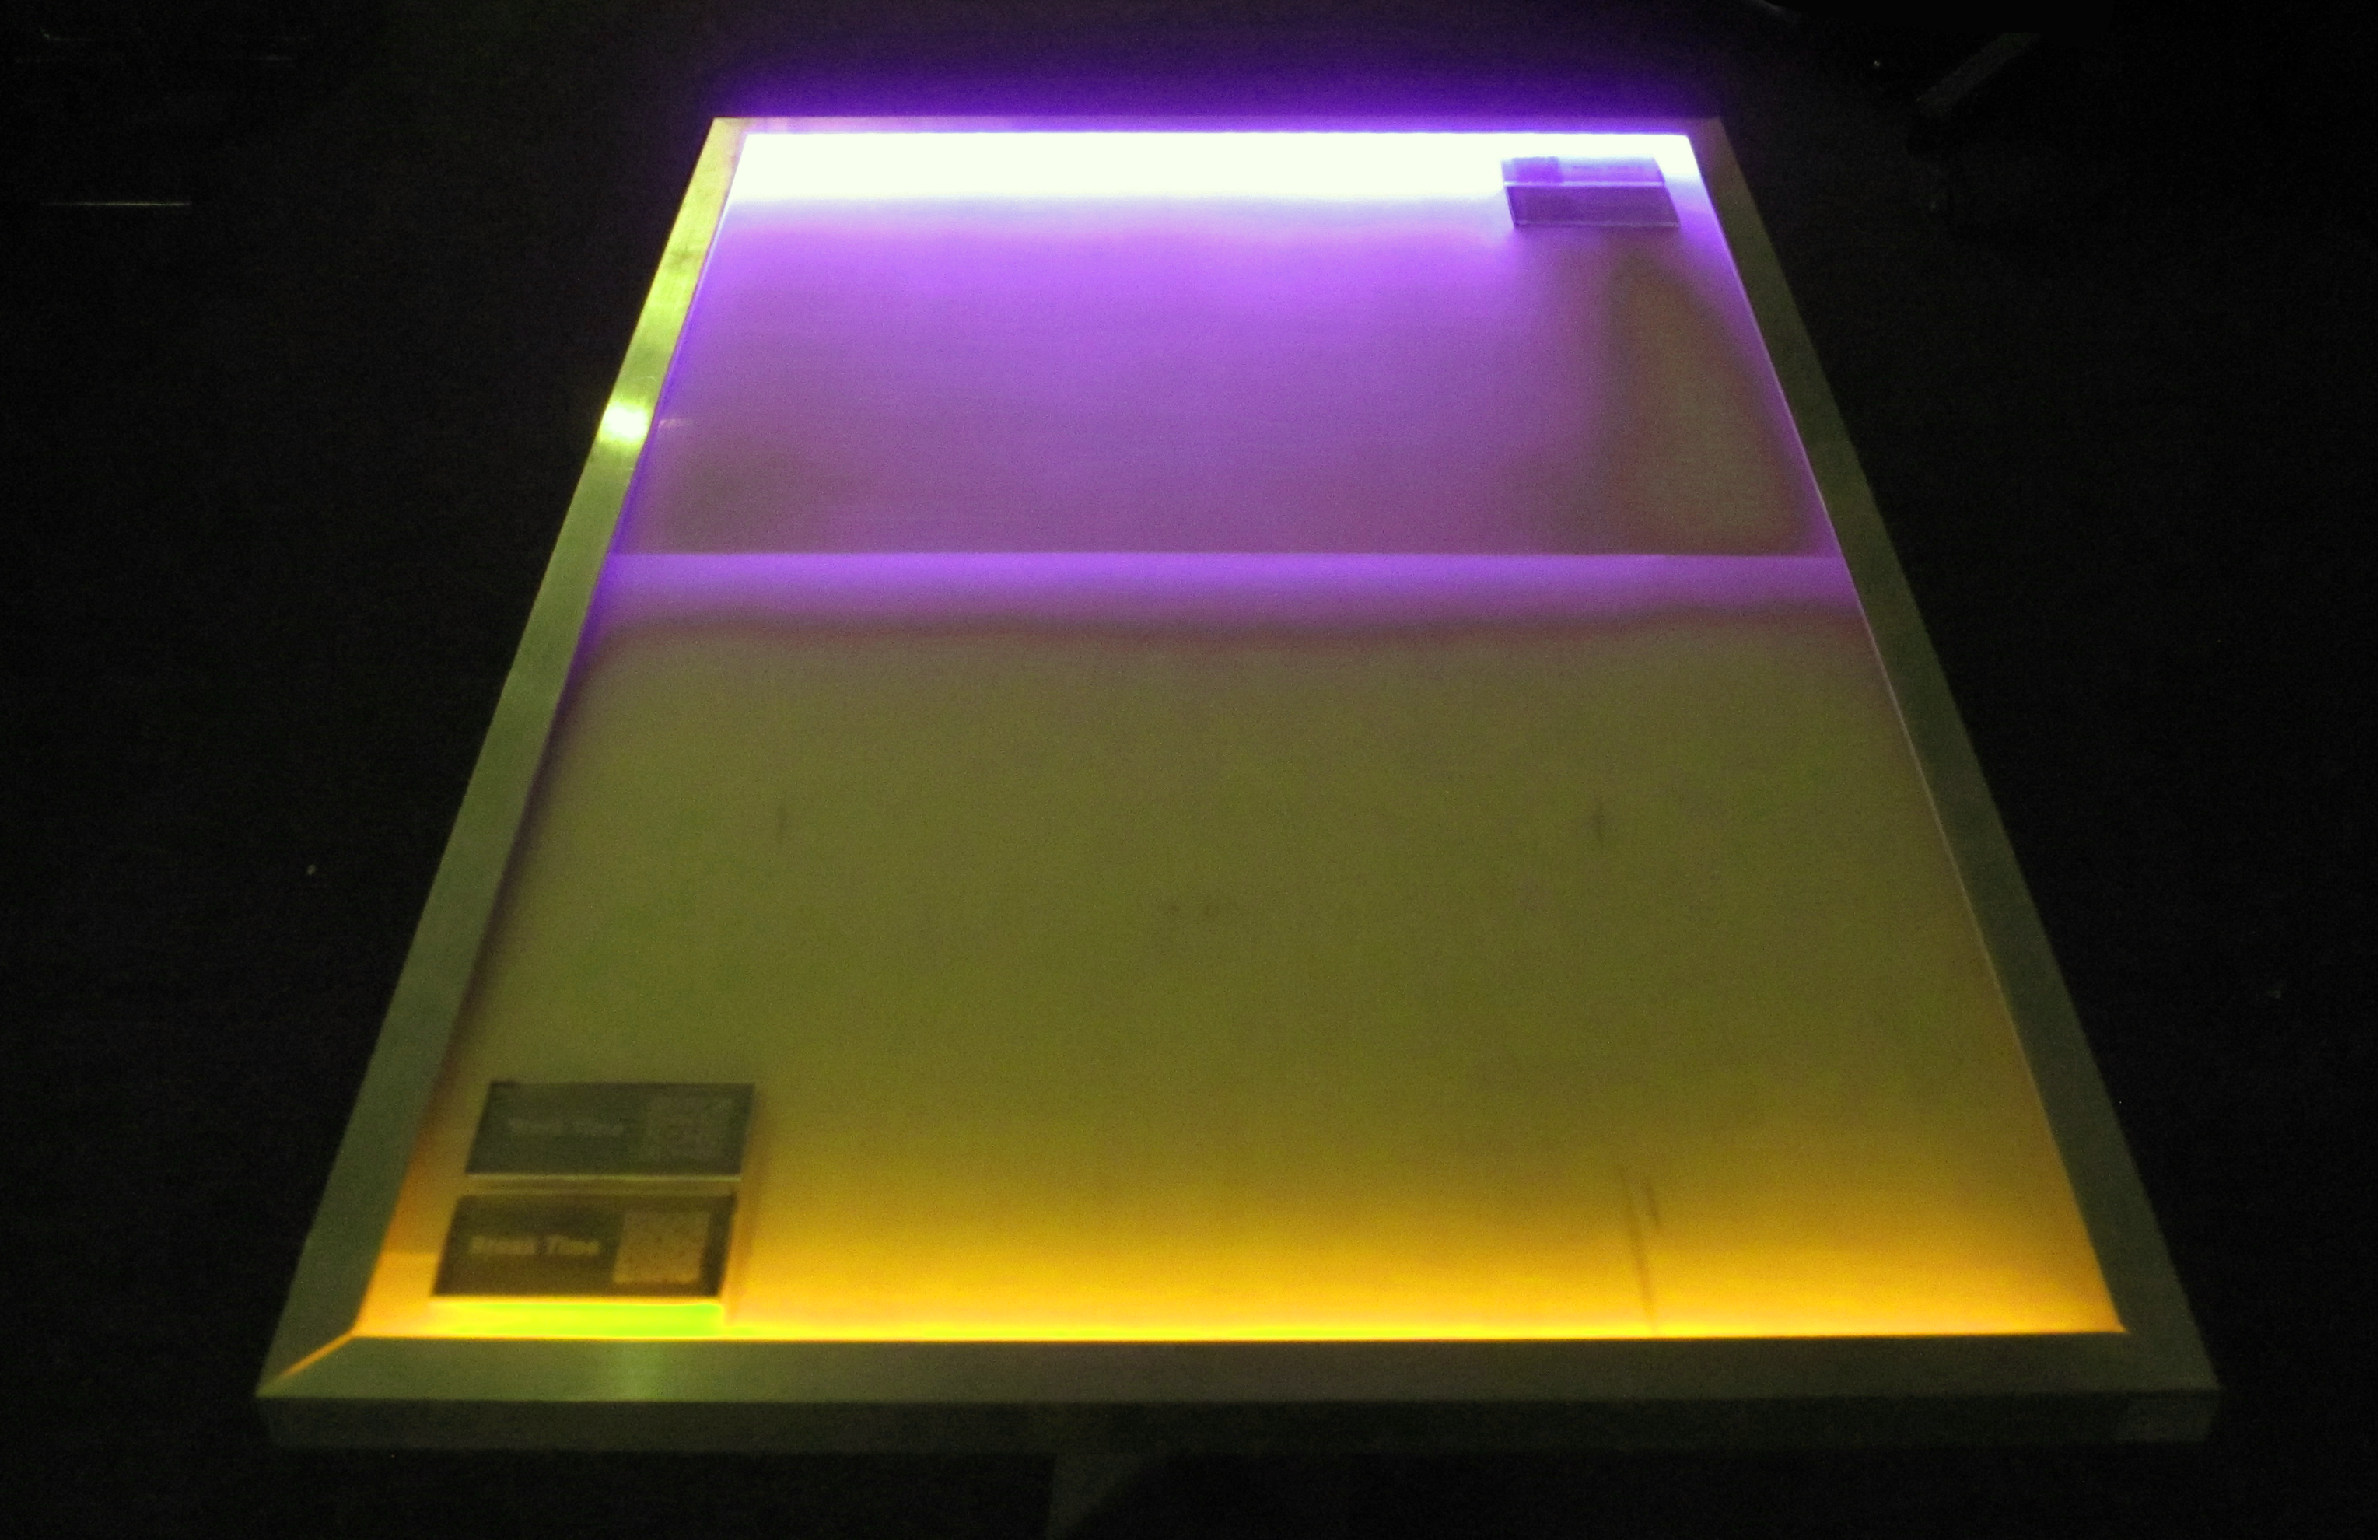
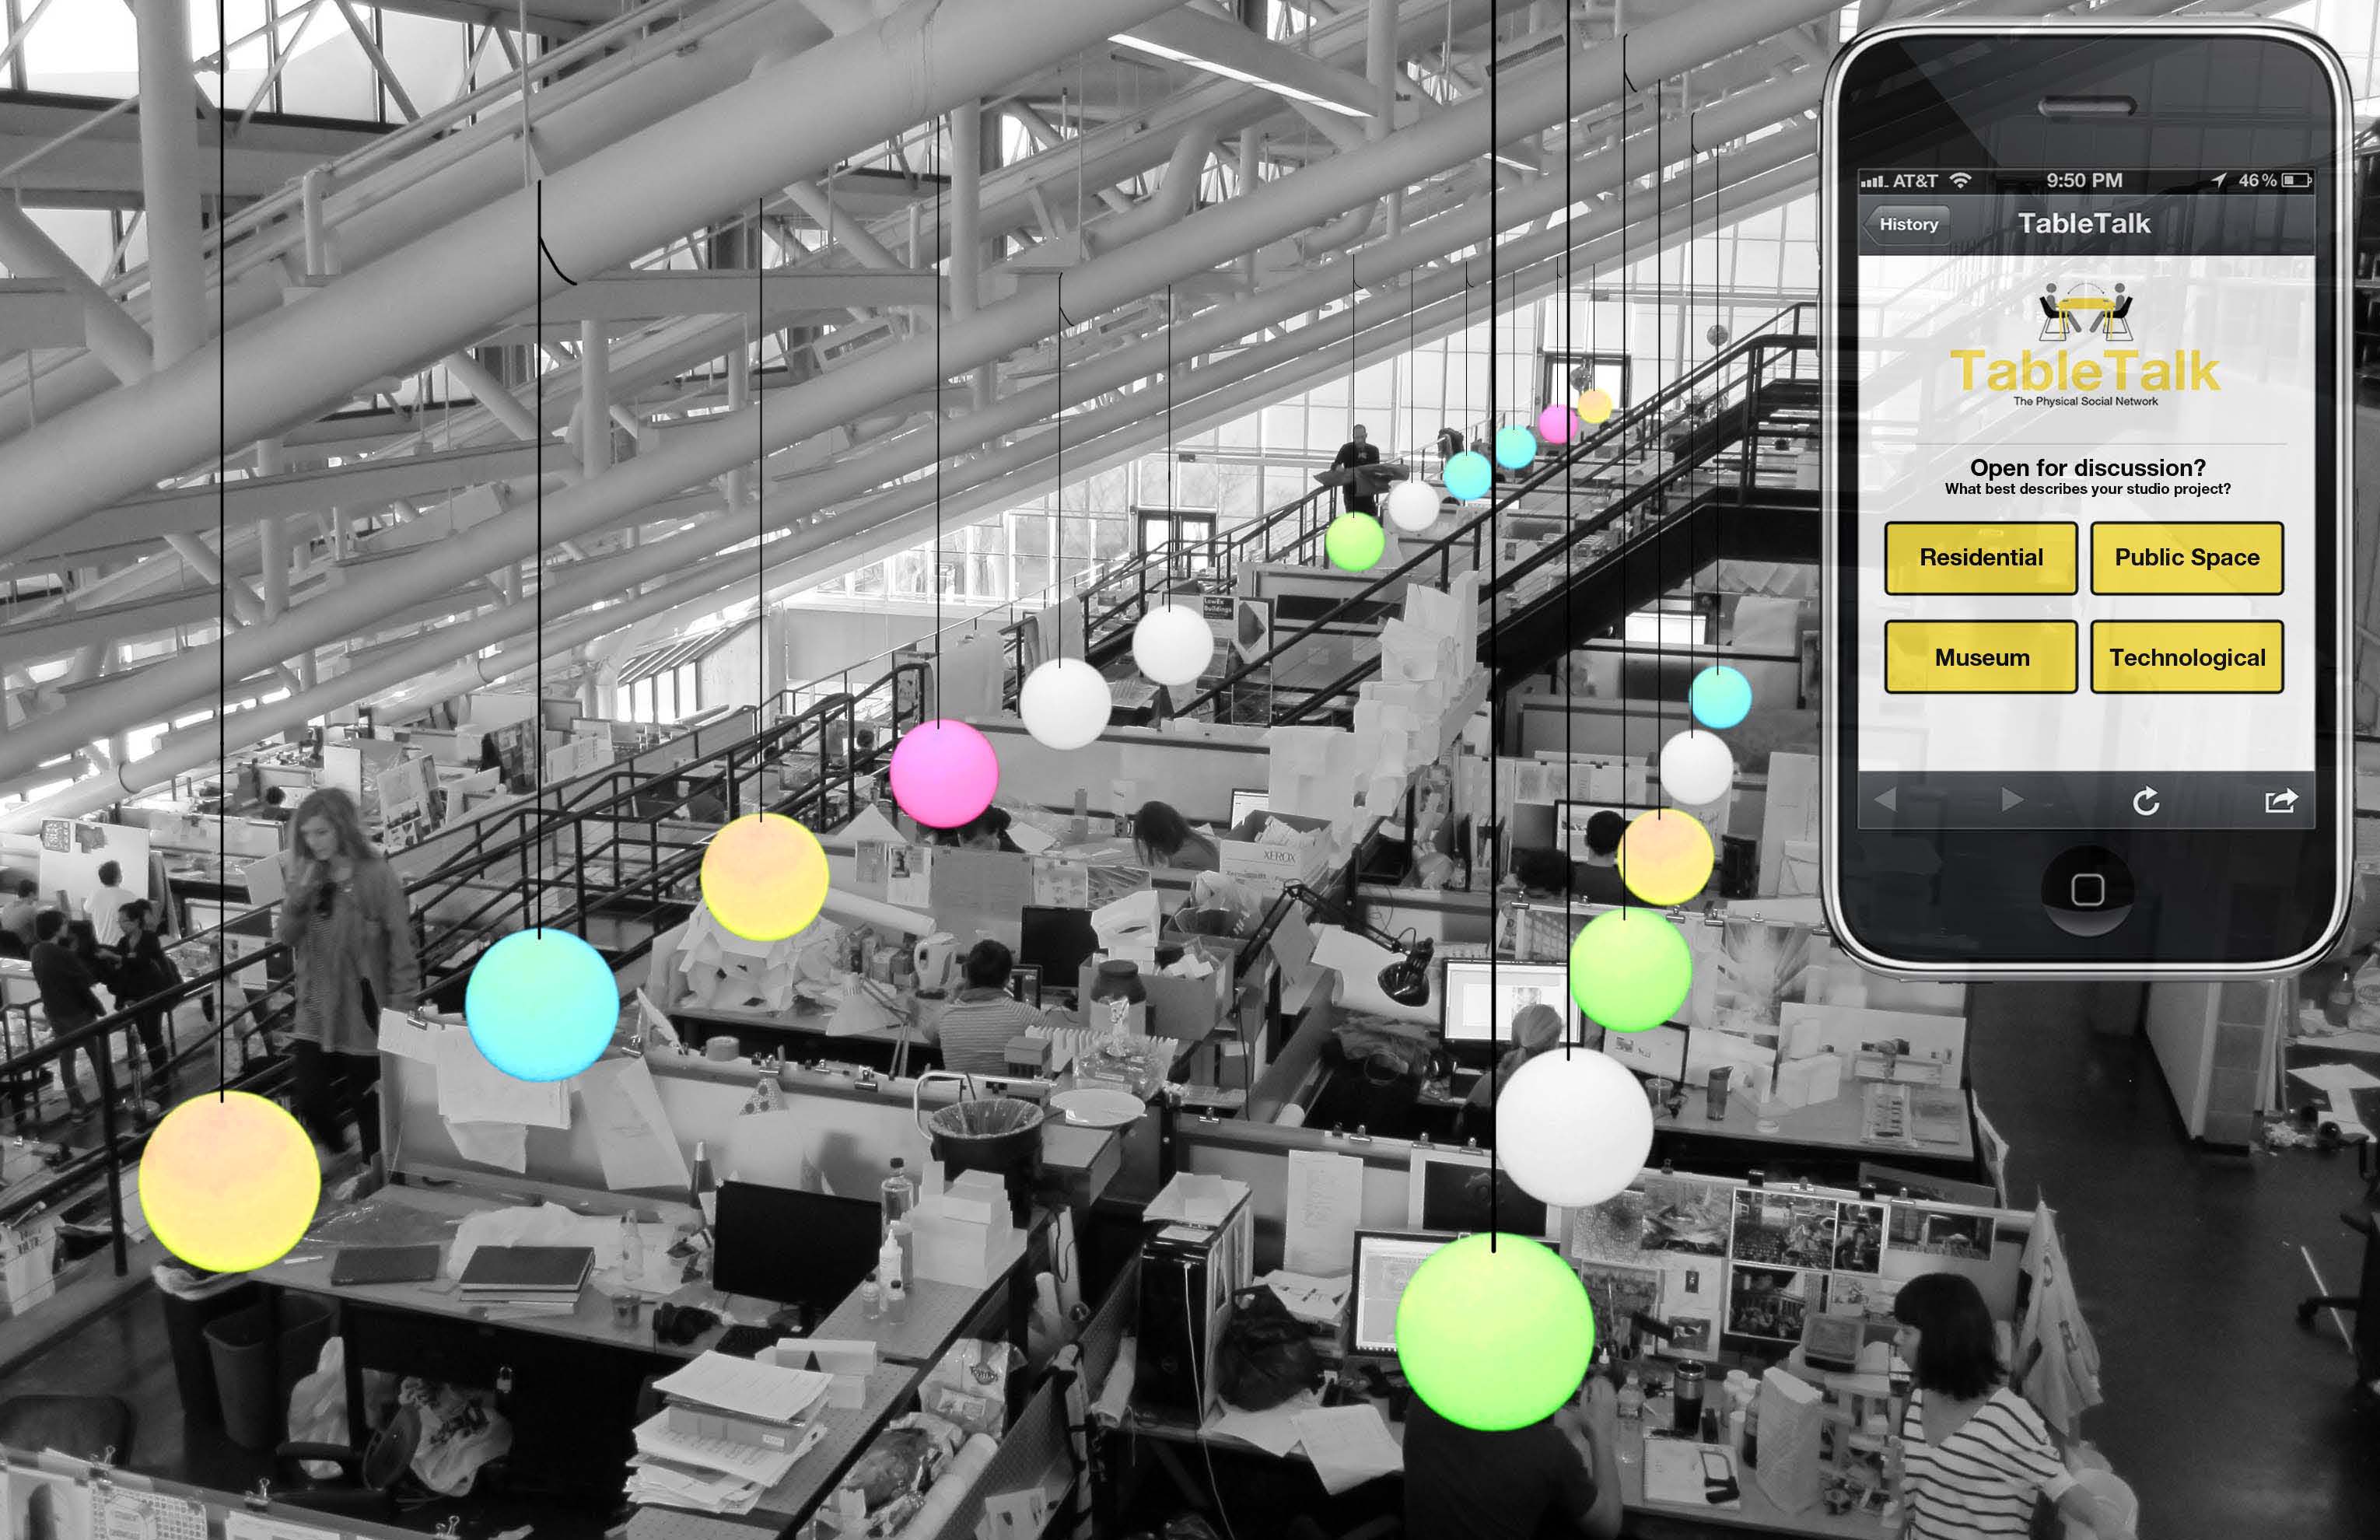
In a fully immersed environment, the technology would be integrated into the table itself; fully combining the digital and physical layers. For this, I designed a responsive table which is capable of absorbing user interest. Depending on the chosen topic, the table adjusts color so that the user is able to quickly look around the room and see others currently in the room with similar interests; breaking that barrier of first conversation starter. The table is also embedded with a QR code which when scanned, connects to all the others who had previously chosen that same seat with the same interest.

By infiltrating unused spaces of our communities with these responsive tables in a layout that promotes social interaction, that ‘in between’ space can begin to act as a place making tool and means for community engagement. This physical social network can begin to connect individuals within the community on deeper and more meaningful levels depending on hobbies, background, research, or need and therefore highlighting the importance of city as place.
Bikenapped is an online platform aimed at raising awareness and mapping bike thefts in Boston. For the public, Bikenapped serves as a place to get a clearer picture of the bike theft problem as well as a community to share your experiences with others. By offering a way for theft victims to reach out to each other, we can learn from our collective experience and band together to help find solutions. The data and narratives that the public provides are valuable as insight to help understand theft patterns and behaviors, as well as the immaterial value of cycling in our city. With better information we can help pursue policy change that can target the problem.
![]()
As Boston works towards becoming a world class bicycling city, promotion of cycling and cycling infrastructure has resulted in significantly rising ridership. However, this increase in cycling correlates with another phenomenon: the dramatic increase in bicycle thefts.
Bike theft is notoriously difficult to investigate, and stolen bicycles are equally difficult to recover. Theft victims often feel violated and helpless in the face of these crimes. There is nowhere for to speak out, no outlet for to take action. By gathering this community of individual voices, we can speak with a collective voice to shed light on the problem, and work together to find solutions.
MAPPING THEFT
One of the issues regarding bike theft lies in the shortage of data on these crimes. According to the reports from the Department of Justice, for every bike theft that is reported to the police, 4 or more thefts may have occurred. This severe underreporting prohibits us from seeing the full scope of the problem and from allocating adequate resources to tackle it. Bikenapped asks the community to participate in a user-generated mapping of theft incidents, to share information with our neighbors and our city.
TAKING ACTION
Raising awareness and disseminating information is crucial in addressing bike thefts. We seek to take the data beyond the digital realm and into the real urban environment we live in. Bikenapped asks users to post notice at the physical place of the theft to warn others of what had happened. The information is not just relevant on the internet, it is more relevant to all the people who use the spaces where these thefts happen.
CONNECTING VOICES
Change happens when we empower everyone to act. While bike theft is something most people experience alone, Bikenapped seeks to connect us with our neighbors and community. If we discover other people had their bikes stolen from the same place as ours, perhaps we can join together to demand for better safety measures in our neighborhood. If law enforcement is aware of certain zones of bike thefts, perhaps they are better equipped to police the area. If we know bikes have been stolen from a particular place, perhaps we will all be more vigilant to keep our neighborhoods safe from bike theft.
PROCESS AND THOUGHTS
The project began through data collection. Through visiting police departments and combing through public log information, we can already begin to see the difficulty in just understanding the bike theft issue in Cambridge. In just the city of Cambridge, there are three separate police departments that holds jurisdiction over different areas: the Cambridge Police Department, the Harvard University Police Department, and the MIT Police Department. In addition the MBTA Transit Police oversees all transit stops. All of these police departments have separate reporting and record keeping methods, which are not collated into a single database, but rather organized internally. From any one source, we can only see a narrow segment of the larger problem. It became clear that in order to understand the issue, we needed a place where information can be collated and made accessible to the public.
Bikenapped became a platform to not merely disseminate information, but also encourage participation. Bike thefts suffer from severe underreporting due to the common perception that nothing will come from a police report. Though the rates of recovery are surely low – and Bikenapped makes no claims at increasing the chances of recovery – a report on Bikenapped is something theft victims and see. It is visible on the map, and visible to every person who comes to visit it. A piece of information or an experience where a victim had once suffered alone, is now directly and visibly a contribution to a larger story and effort.
The reaction to Bikenapped has been extremely positive. As different media outlets and cycling blogs began to pick up the story, reports and emails started coming in. We had over 2500 unique visitors within the first 12 days, many from beyond the borders of Boston/Cambridge, all the way from Portland and California. The issue surely struck a cord to people, and the support and response that Bikenapped received validated the need for its existence.
1 2 3 … 7 Next »