Networked Urbanism
design thinking initiatives for a better urban life
apps awareness bahrain bike climate culture Death design digital donations economy education energy extreme Extreme climate funerals georeference GSD Harvard interaction Krystelle mapping market middle east mobility Network networkedurbanism nurra nurraempathy placemaking Public public space resources Responsivedesign social social market Space time time management ucjc visitor void waste water Ziyi
The carbon counters (in both physical and digital form) are meant to stimulate discussion about carbon emissions and climate change at the school of design. The impact that our buildings have on the environment is an issue that is often glossed over at the school of design as it is in most public discussions. If we want to address our concerns for the environment, issues of climate change need to be brought into our collective consciousness and that starts with raising awareness about own carbon footprint.
Climate change is an issue of global concern, with deep roots connected to everything from aging infrastructures to shortsighted policies and regulations. However climate change is also largely the result of behaviors caused by a lack of awareness about the impact our actions have on the environment. Every time we use our computers, turn on the air conditioning, or take a shower, we are releasing carbon into the atmosphere and contributing (in a small but nonetheless significant way) to global climate change. As a result of this general unawareness, people leave their lights on during the day, turn the air conditioning on high in the summer, and take hot showers longer than necessary – exacerbating the problem of global warming.
This semester began with an assumption that educating the public about the way our built environment works, specifically the way our built environment uses energy and contributes to the problem of global warming, has the potential to correct some of our more problematic behaviors. One component of education is finding ways to visualize the invisible yet ubiquitous energy infrastructure and how that infrastructure operates. The other is to visualize the real-time impact our buildings have on the environment, and in so doing affect the decisions we make regarding how we interact with the built world.
While there are undoubtedly many ways to communicate this information, the studio was an opportunity to experiment with an unfamiliar medium: animation. The first experiment involved an animation describing the movement of energy from the point of resource extraction to the point of consumption (the city of Boston). Since Boston, like many northeastern cities, creates most of its useable energy from burning natural gas, the animation begins in the Mississippi Delta where most of the nation’s natural gas is processed before it travels via one of several large pipelines to the electric generation facility. The fact that Boston relies heavily on natural gas for its electric generation is an important point because it enables one to calculate the amount of carbon created per kilowatt-hour of electricity generated.
This first animation was an introduction to new tools, and new techniques of representation. While it was an informative exercise, it failed to communicate the urgency of reducing our collective energy footprint. The description of resource movement from source to sink was ultimately too abstract and removed from the everyday behaviors of ordinary citizens. Using the lessons learned from this first iteration, the second animation used data collected from actual buildings to concretize what was formerly too abstract.
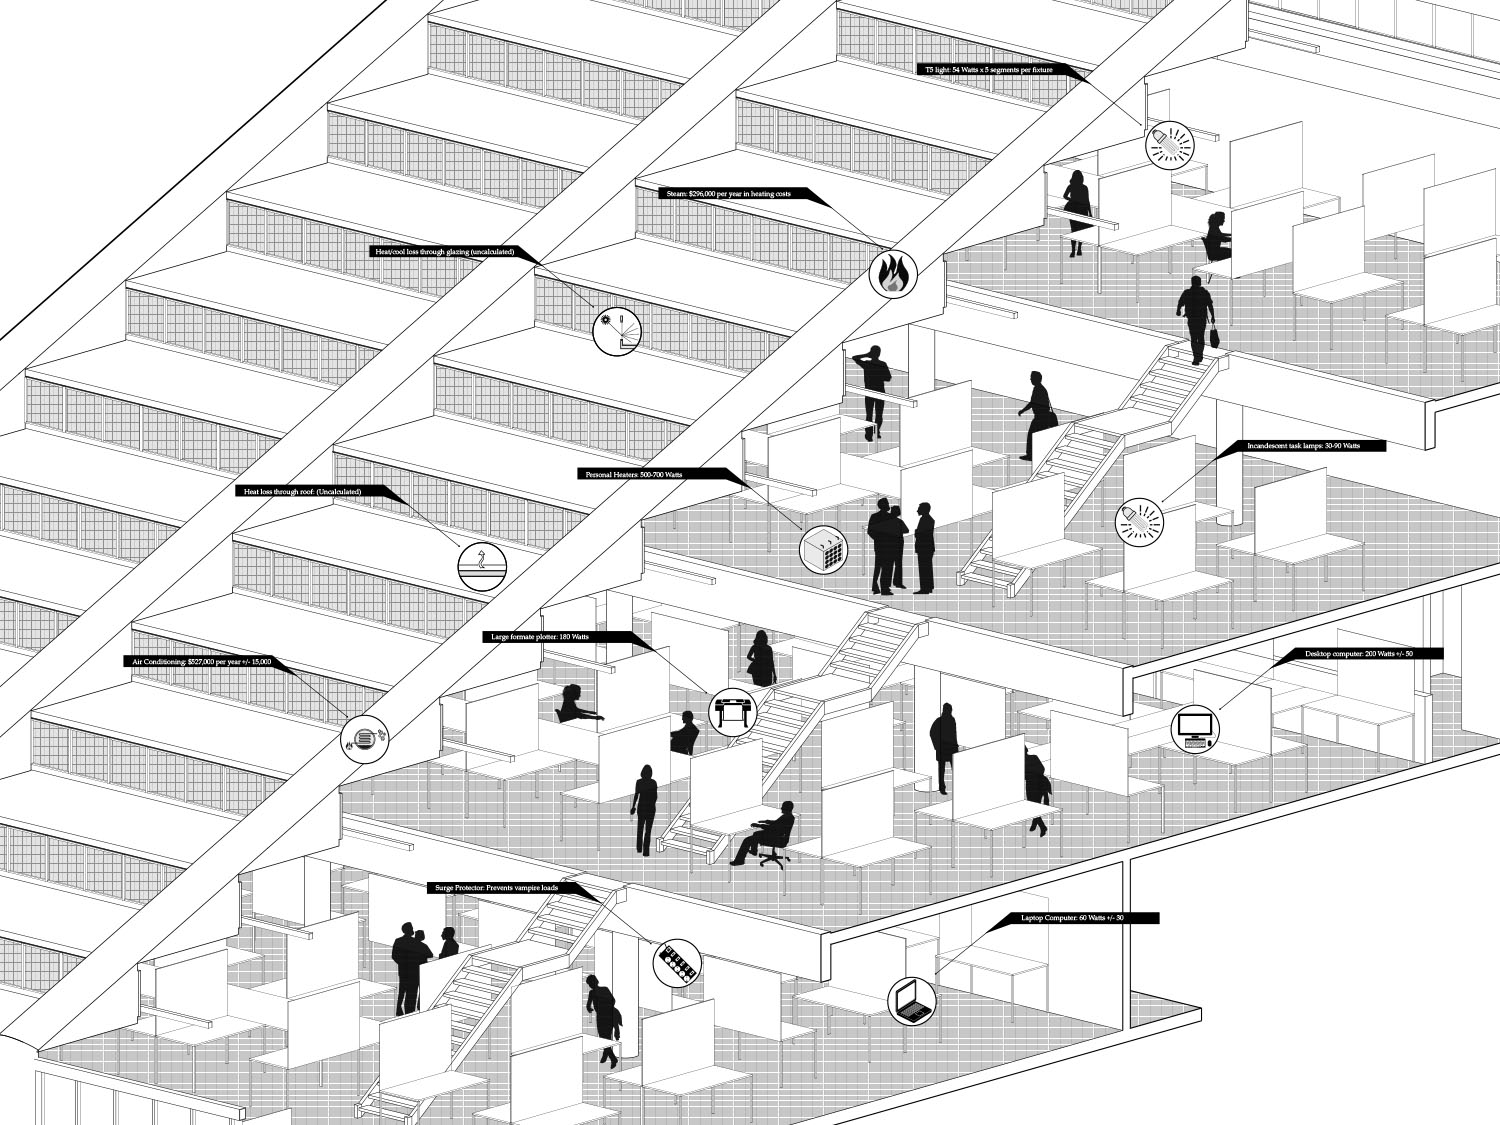
Even with the complexities involved in the processes of energy generation and transmission (deregulated markets, interconnected power grids…etc.) collecting and animating information about how specific buildings or groups of individuals use energy is decidedly more difficult. In order to streamline the research, Gund Hall served as a test kitchen because of their psuedo open data portal to energy monitoring systems. Real-time data on everything from lighting loads to steam use is continuously collected, packaged, and then emailed as a text file once per day. Using this information, the numbers in the animation are presented in traditional terms, such as a Kilowatt-Hours for electricity used for lighting and therms for heating, as well as comparative figures such as number of houses powered per year. For example, the amount of energy used to light Gund Hall is equal to the amount of energy it would take to power 208 medium sized houses. The numbers and figures are also presented in relation to other buildings on the Harvard campus as a way to accentuate the point that Gund uses more energy per square foot than almost any other building in the area except the Science Center (and most of this energy goes toward unnecessarily lighting the building during all hours of the day).
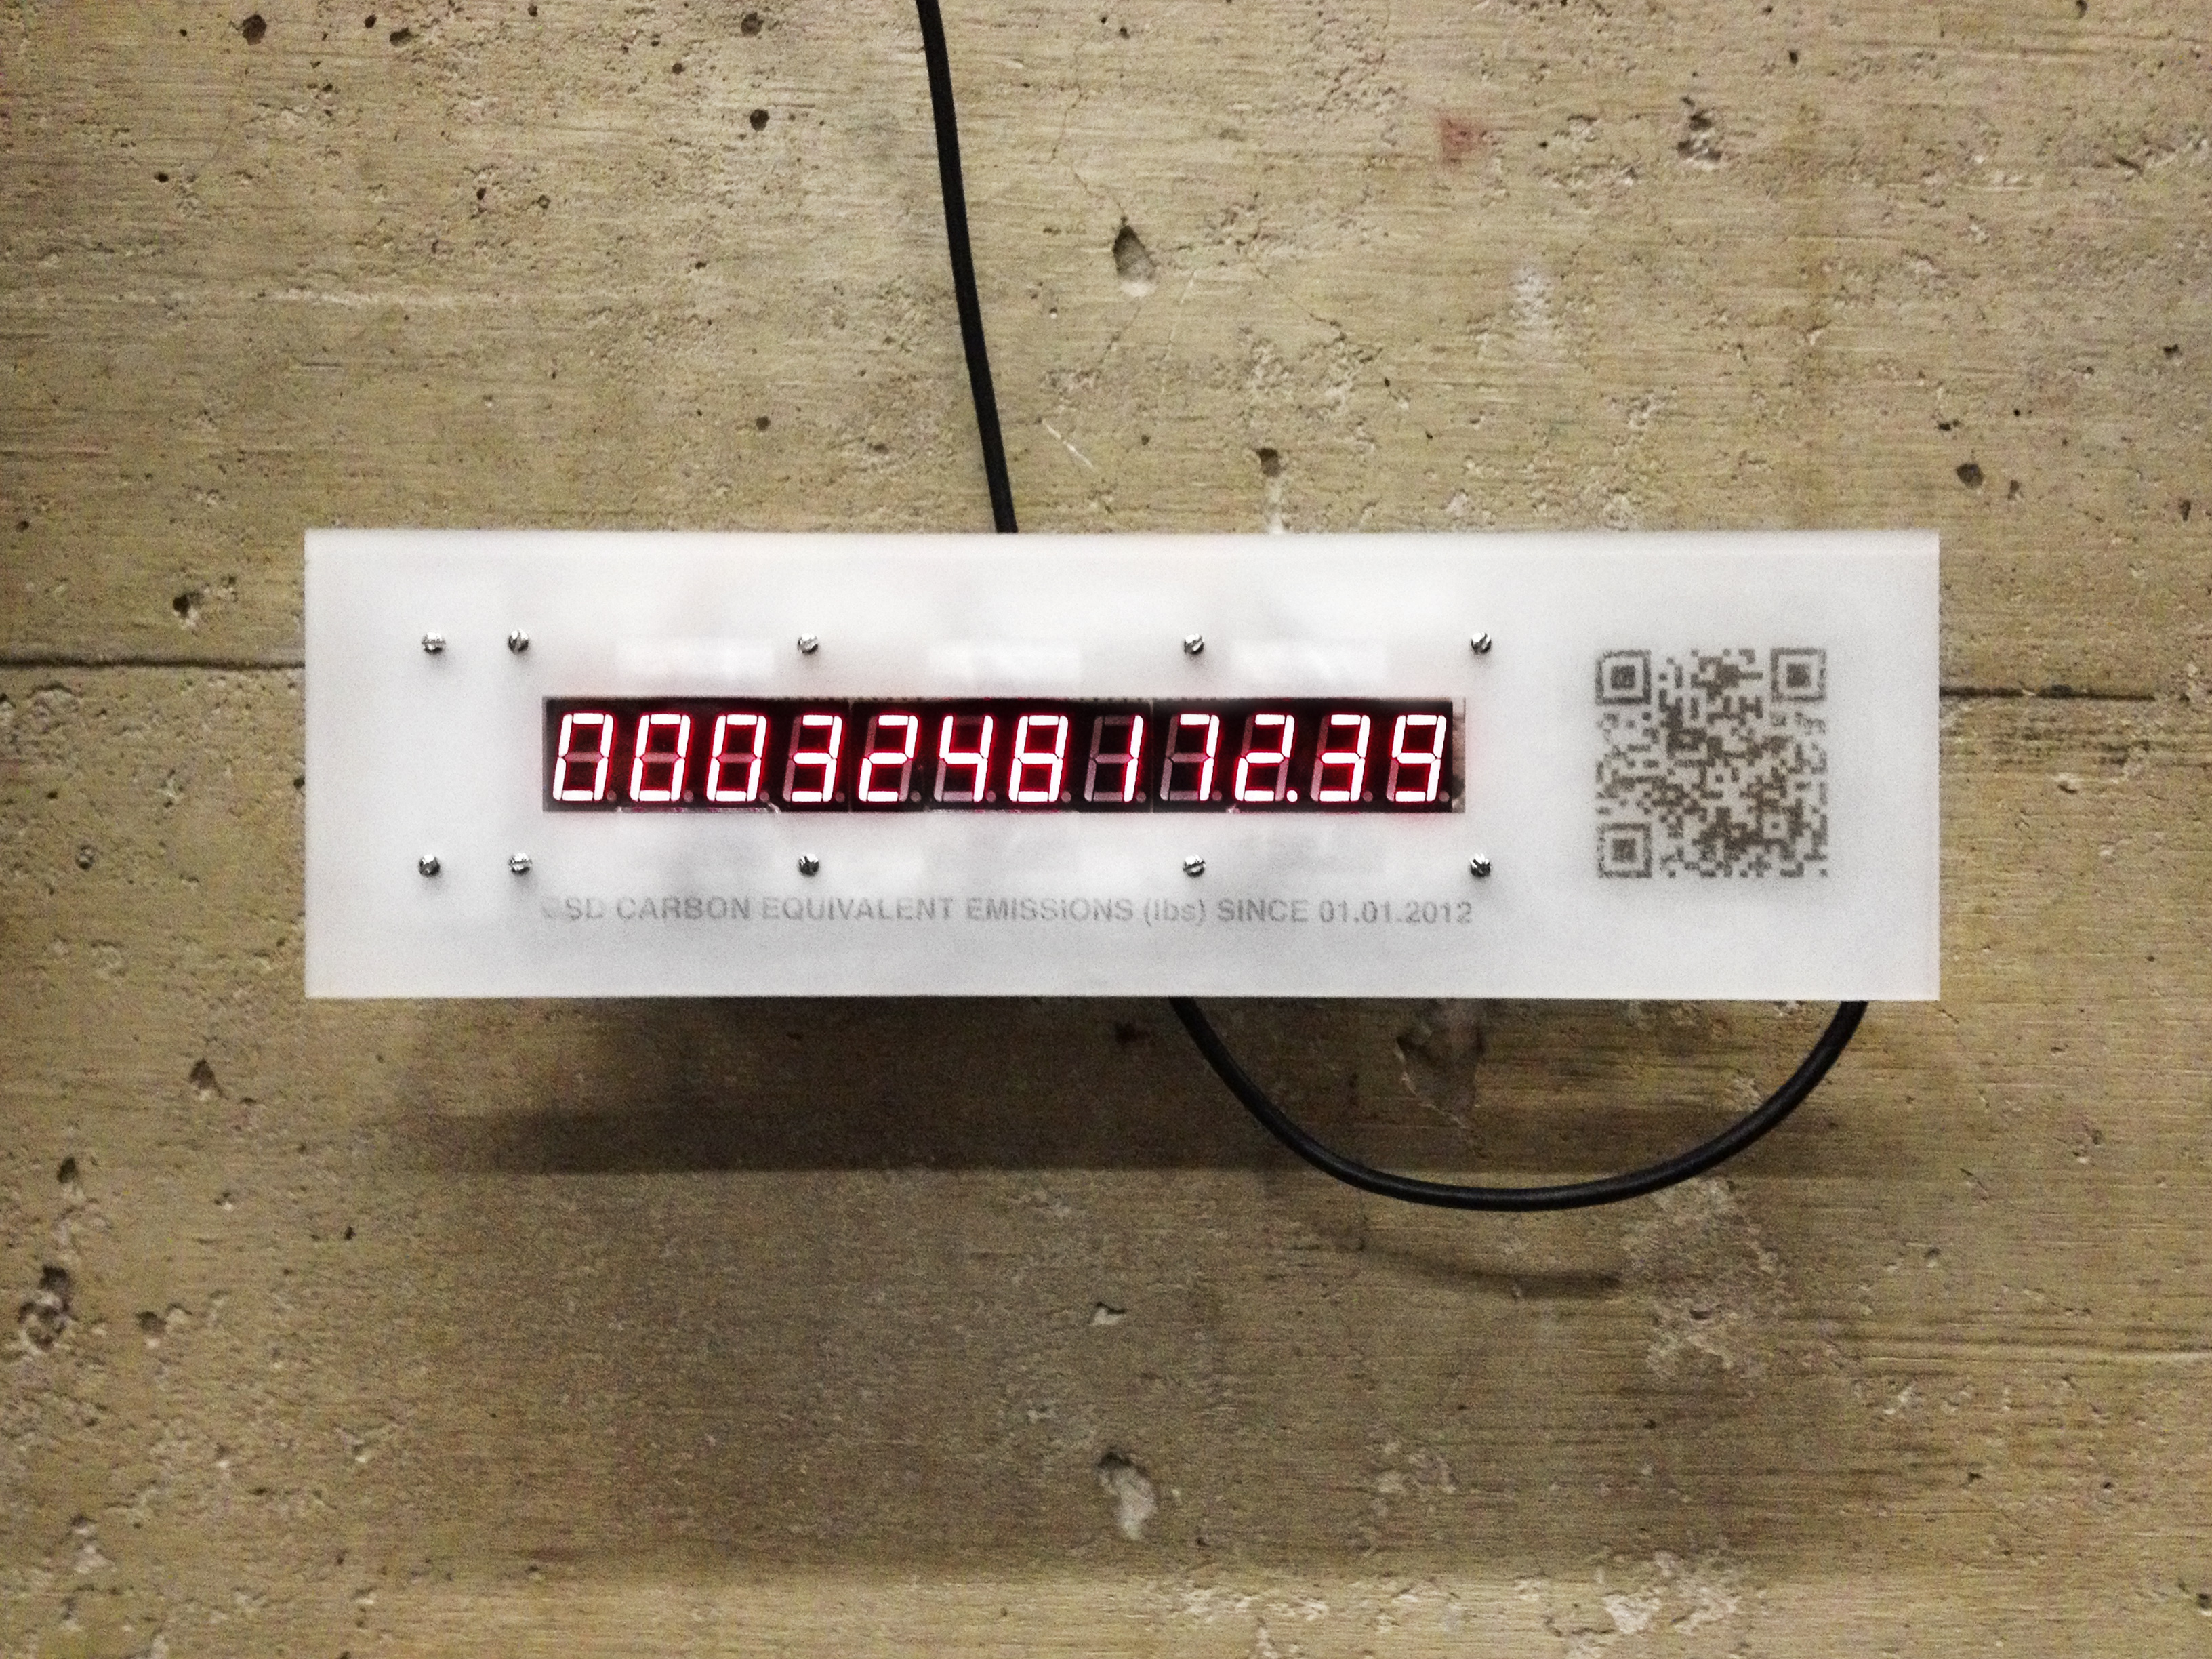
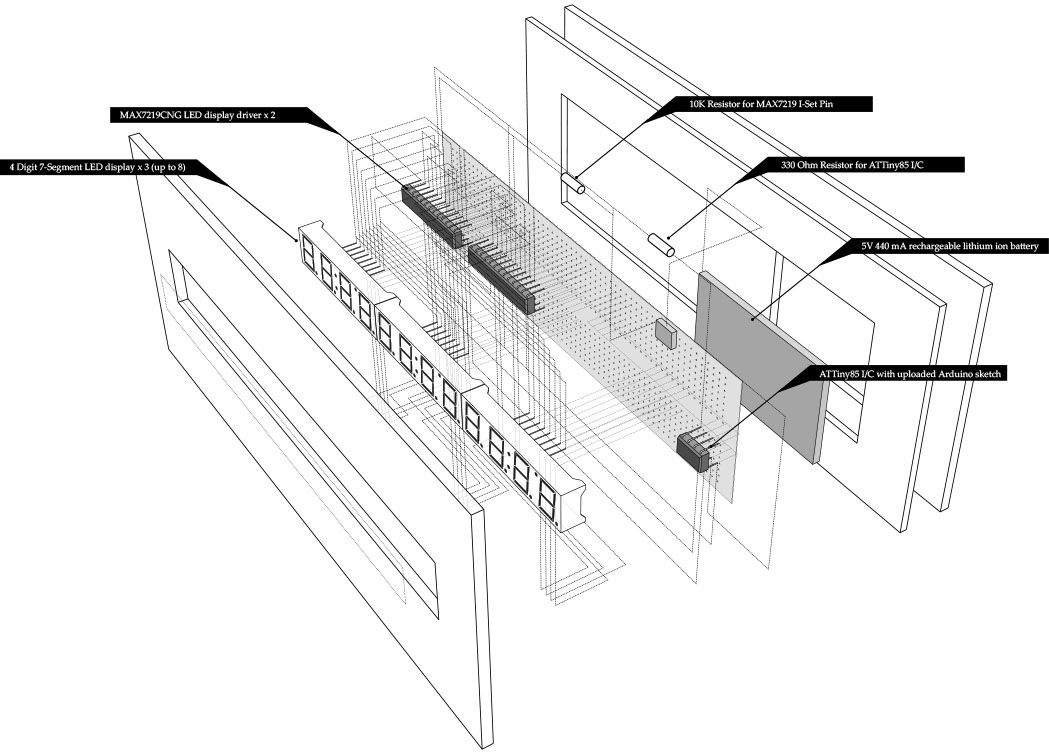
This animation played in the Chauhaus alongside a device that reads the (almost) real-time carbon emissions of Gund Hall. Although the output from this carbon counter is a simple number, the device was designed as an object of intrigue that people could walk up to and investigate – a dynamic and slightly more interactive type of informative poster.
These types of displays are particularly important for the design school, since we as designers are rarely confronted with the reality of how our creations impact the environment. Buildings account for almost half of all carbon emissions in the United States, and designers have a responsibility to create an efficient and responsible built environment. If an awareness of energy use becomes part of our consciousness as designers, and if we are constantly reminded of the ways in which our creations use energy, we are more likely to design and create a better built environment for the future.