Networked Urbanism
design thinking initiatives for a better urban life
apps awareness bahrain bike climate culture Death design digital donations economy education energy extreme Extreme climate funerals georeference GSD Harvard interaction Krystelle mapping market middle east mobility Network networkedurbanism nurra nurraempathy placemaking Public public space resources Responsivedesign social social market Space time time management ucjc visitor void waste water Ziyi

apps
Creating tools for visualization, communication and action in the city. Online, mobile or even desktop applications that allow citizens to get involved in new ways. Designing interfaces that translate data from complex realities into actionable and easy to read/write elements.
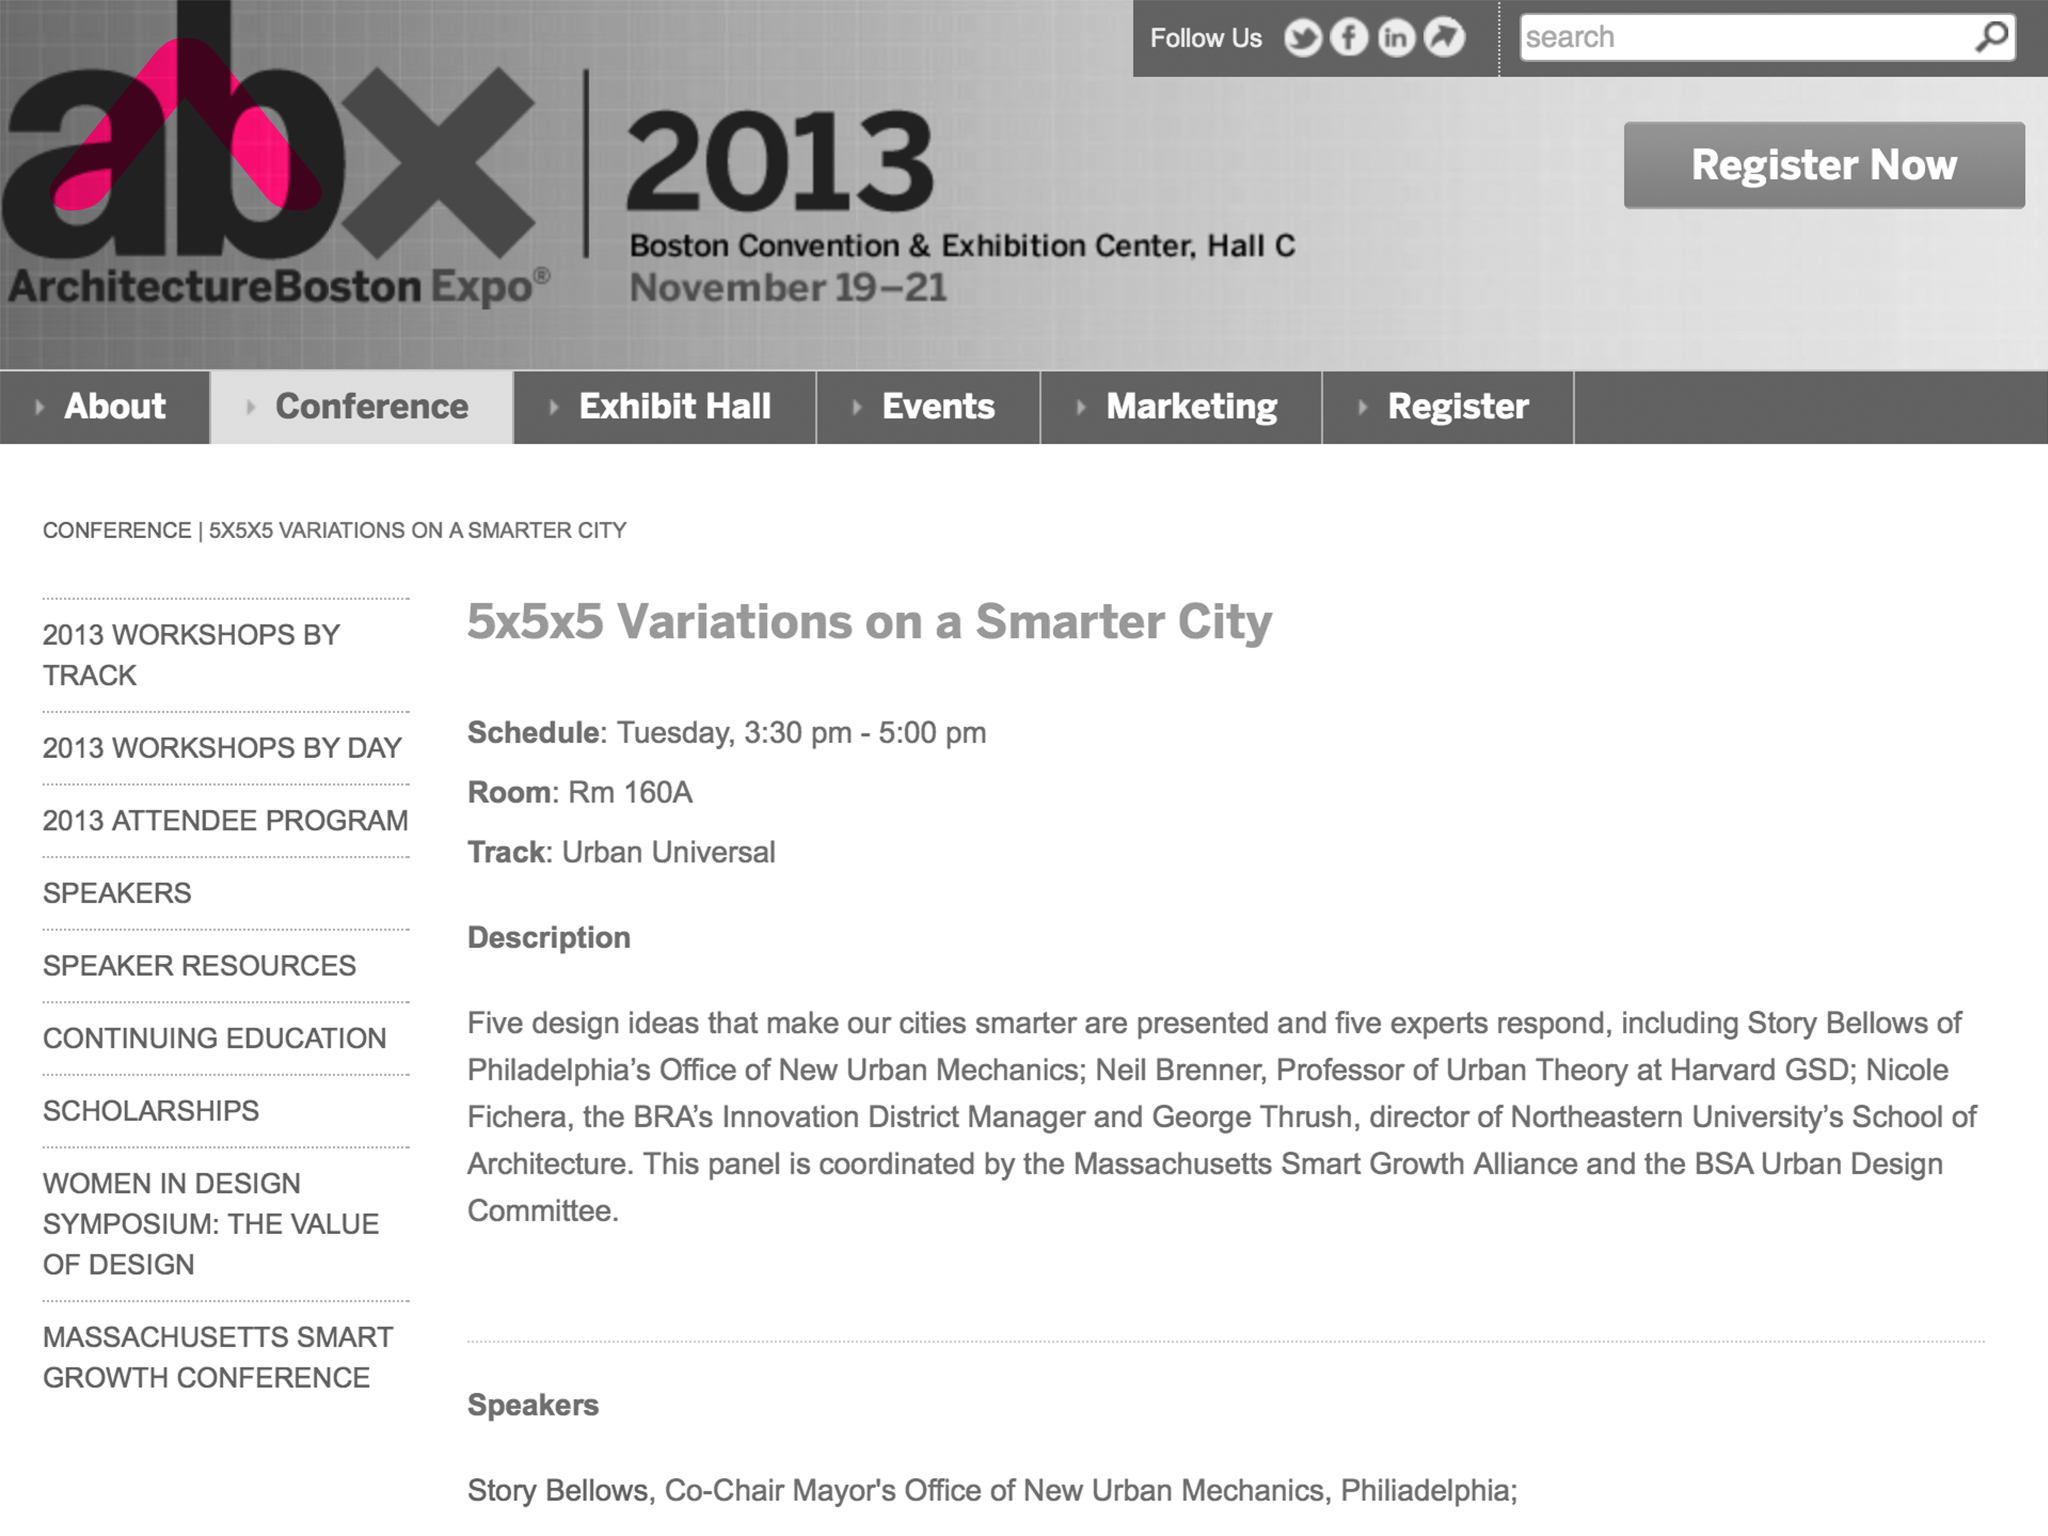
We got excited when we found out that the 5x5x5 submission we blogged about earlier was successful. In consequence, we will present our idea at Boston’s Architecture Exposition next Tuesday. As luck has it, we will also speak at MIT twice next week. If nothing else, we are looking forward to some really good feedback from experts of the field.
Follow this link for the event: http://www.abexpo.com/conference/5x5x5-variations-on-a-smarter-city/
Scott Liang | TJ McCourt | Benjamin Scheerbarth
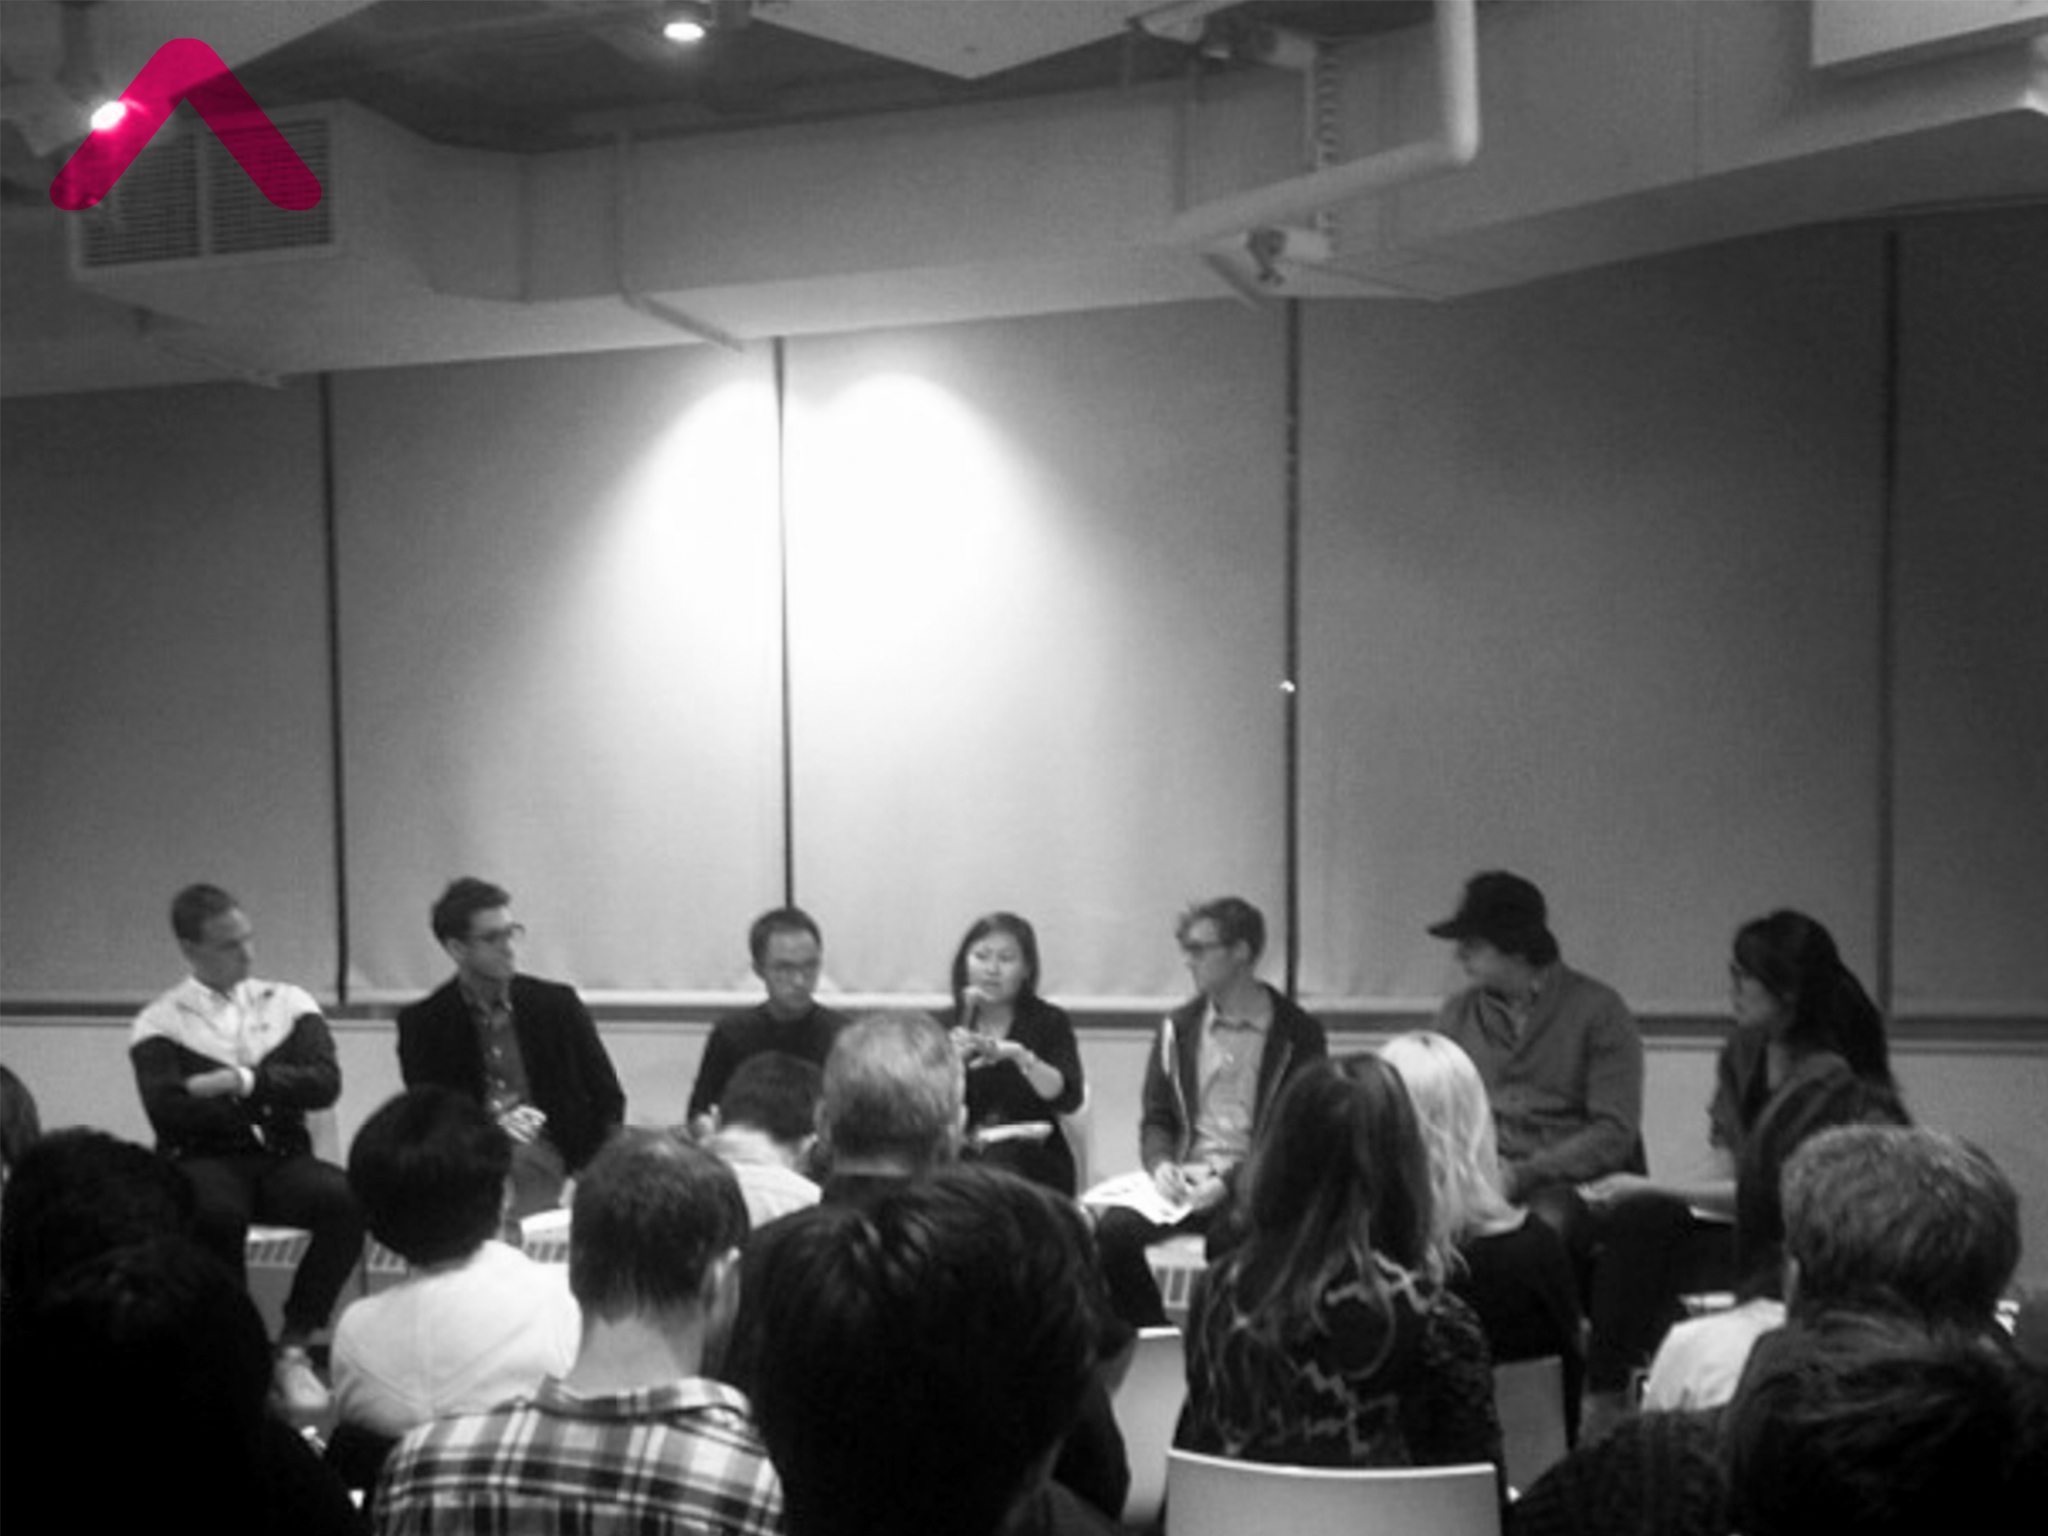
This week, we went to Harvard’s iLab for a panel discussion on design and entrepreneurship. Although the speakers addressed this relationship on a higher level than we do (design impact on business models), we came out inspired to test our technology sooner rather than later, expose its flaws, get feedback, and adjust incrementally.
Follow this link for the event: http://ilab.harvard.edu/calendar-event/content/design-entrepreneurship
Scott Liang | TJ McCourt | Benjamin Scheerbarth
This week was a great week in terms of the amount of feedback we received at studio midterms. While this can be a grueling exercise, it is certainly a luxury to be exposed to people who find the wholes of the project and brainstorm their filling with you. We will now take in some new ideas and readjust our focus for the next weeks.
Scott Liang | TJ McCourt | Benjamin Scheerbarth
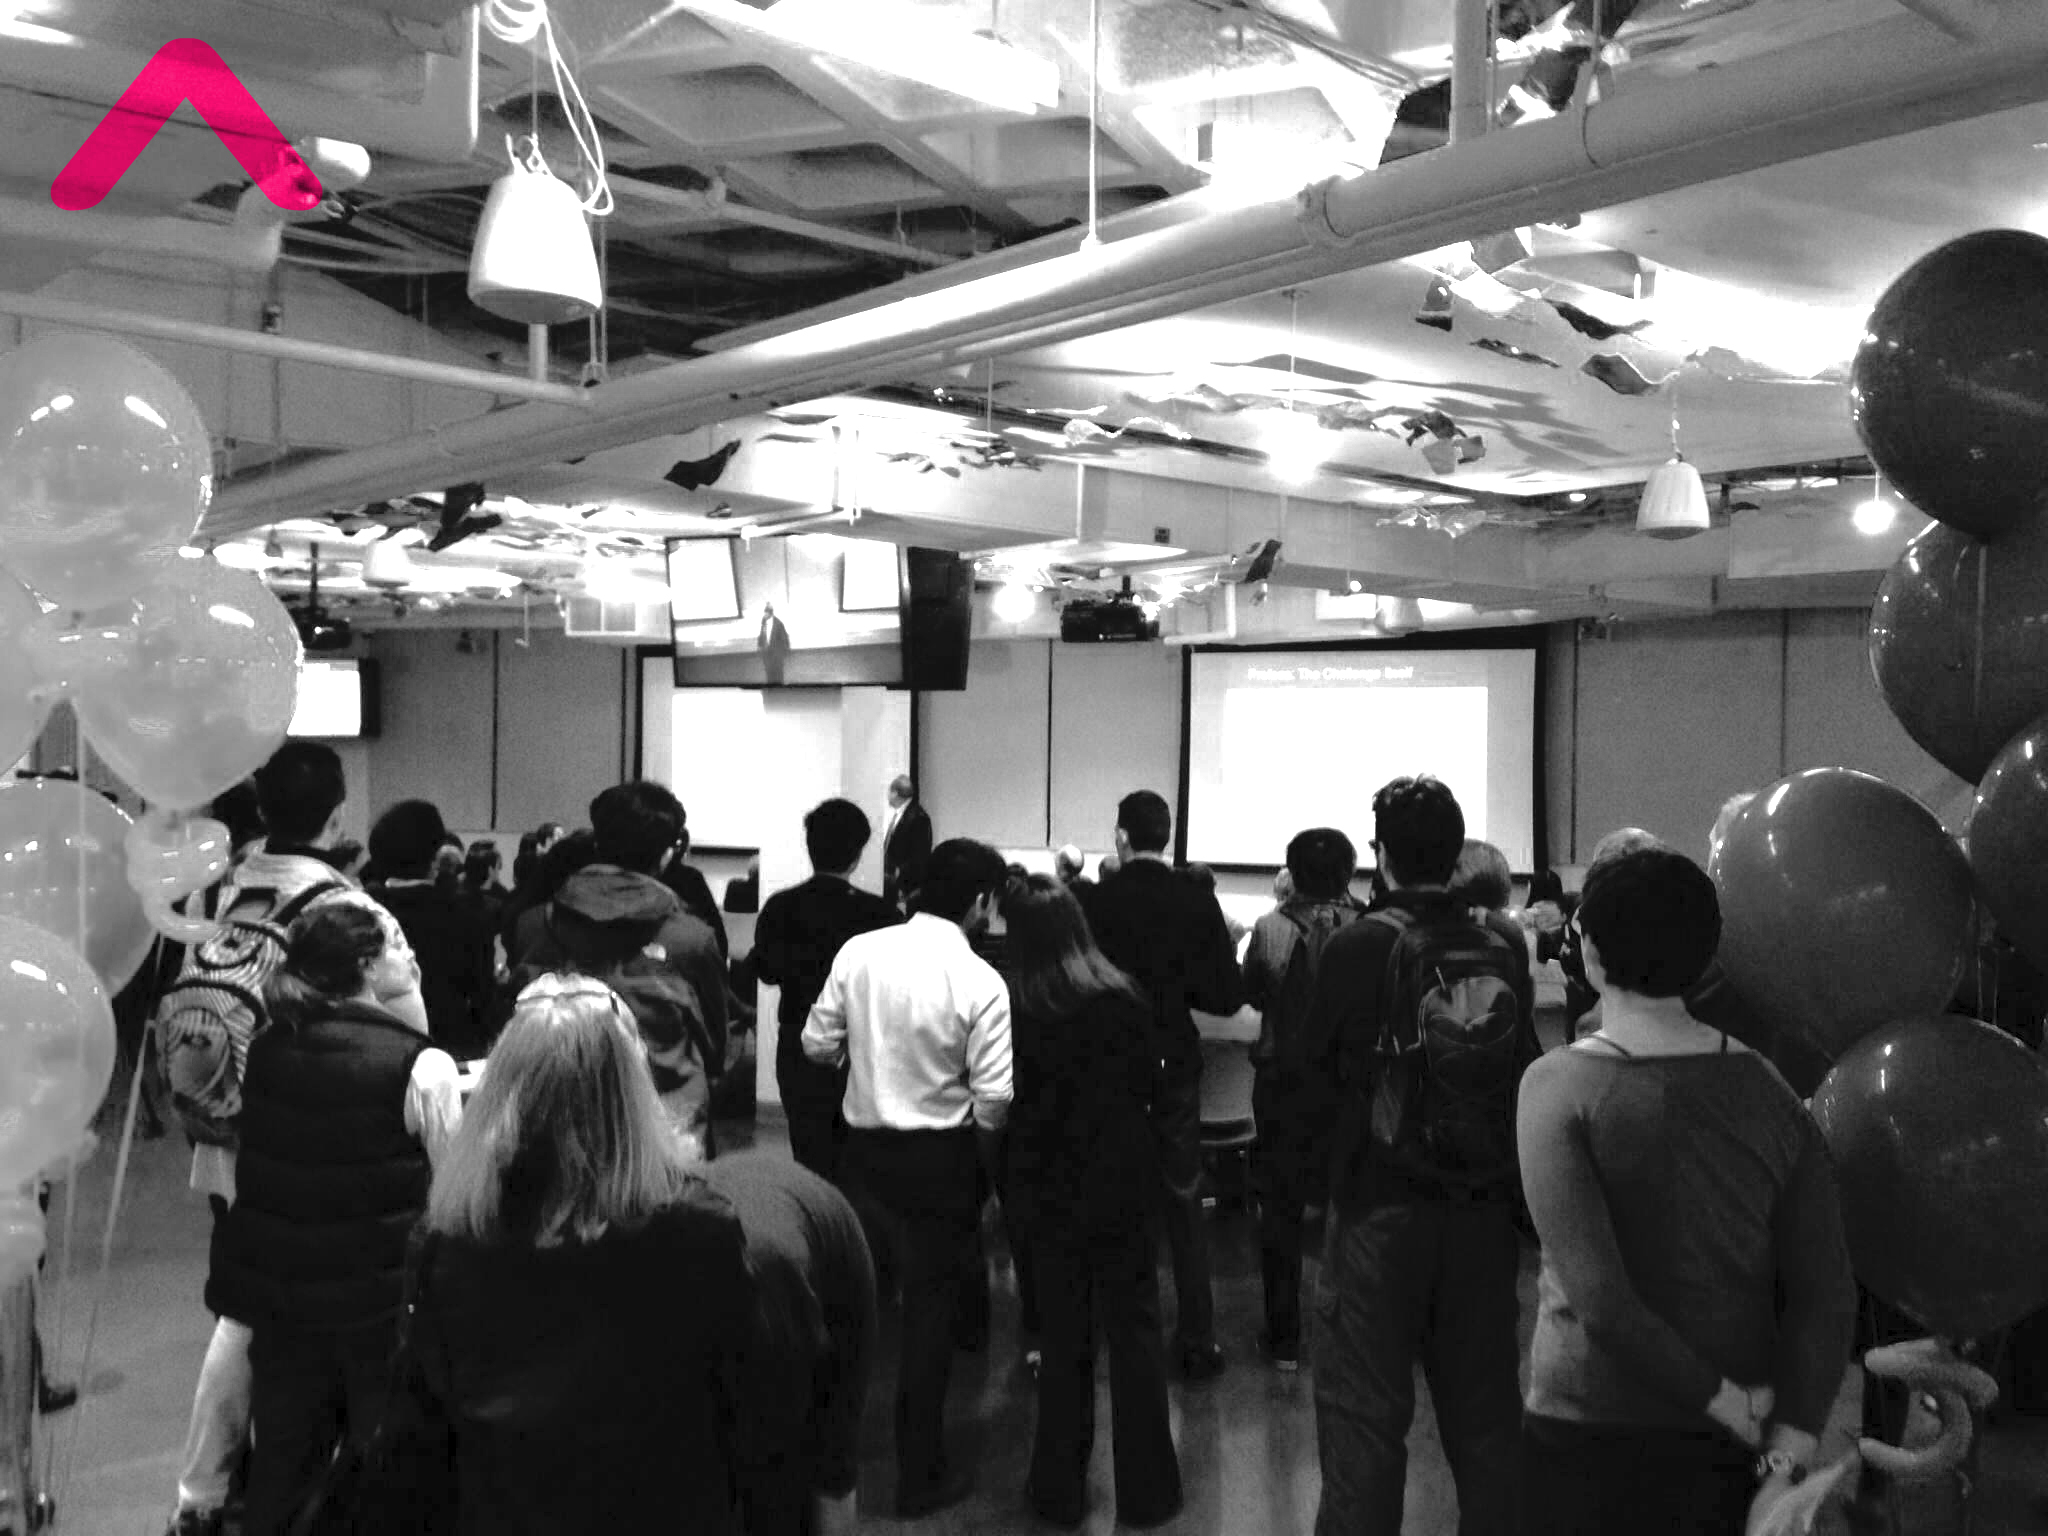
This week we came across the President’s Challenge for entrepreneurship hosted by the Harvard Innovation Lab. With ‘efficient governing’ launching as a new category this year, we might work on putting together a submission. At the information meeting, we already met a few people who expressed interest in our project. In following up with these new connections, we hope to not only to kindle beneficial relationships, but perhaps spark a new and exciting endeavor.
Follow this link for the website of the challenge: http://ilab.harvard.edu/experiential-learning/presidents-challenge
Scott Liang | TJ McCourt | Benjamin Scheerbarth
5x5x5 Scheerbarth Liang McCourt from Scott Liang on Vimeo.
This week was dictated by preparing our submission for the 5x5x5 Variations on a Smarter City competition hosted by the Urban Design Committee of Boston’s Society of Architects. The accompanying conference fits our project idea beautifully and we hope to get exposure to the jurors in the process. Preparing the submission video certainly helped to tighten the project narrative.
Follow this link for the call for entries: http://www.architects.org/committees/news/urban-design-committee-call-video-entries-5x5x5-variations-smarter-city
Scott Liang | TJ McCourt | Benjamin Scheerbarth
On September 30th, we went to visit the MIT Senseable City Lab. We were shown around the lab and introduced to a selection of past and current projects. Check out the video for some detailed introductions to a selection of four projects, responsive environments, local warming, signature of humanity, and live singapore. Thank you Anthony for your time and the warm welcome.
Follow this link for the website of the lab: http://senseable.mit.edu
Scott Liang | TJ McCourt | Benjamin Scheerbarth
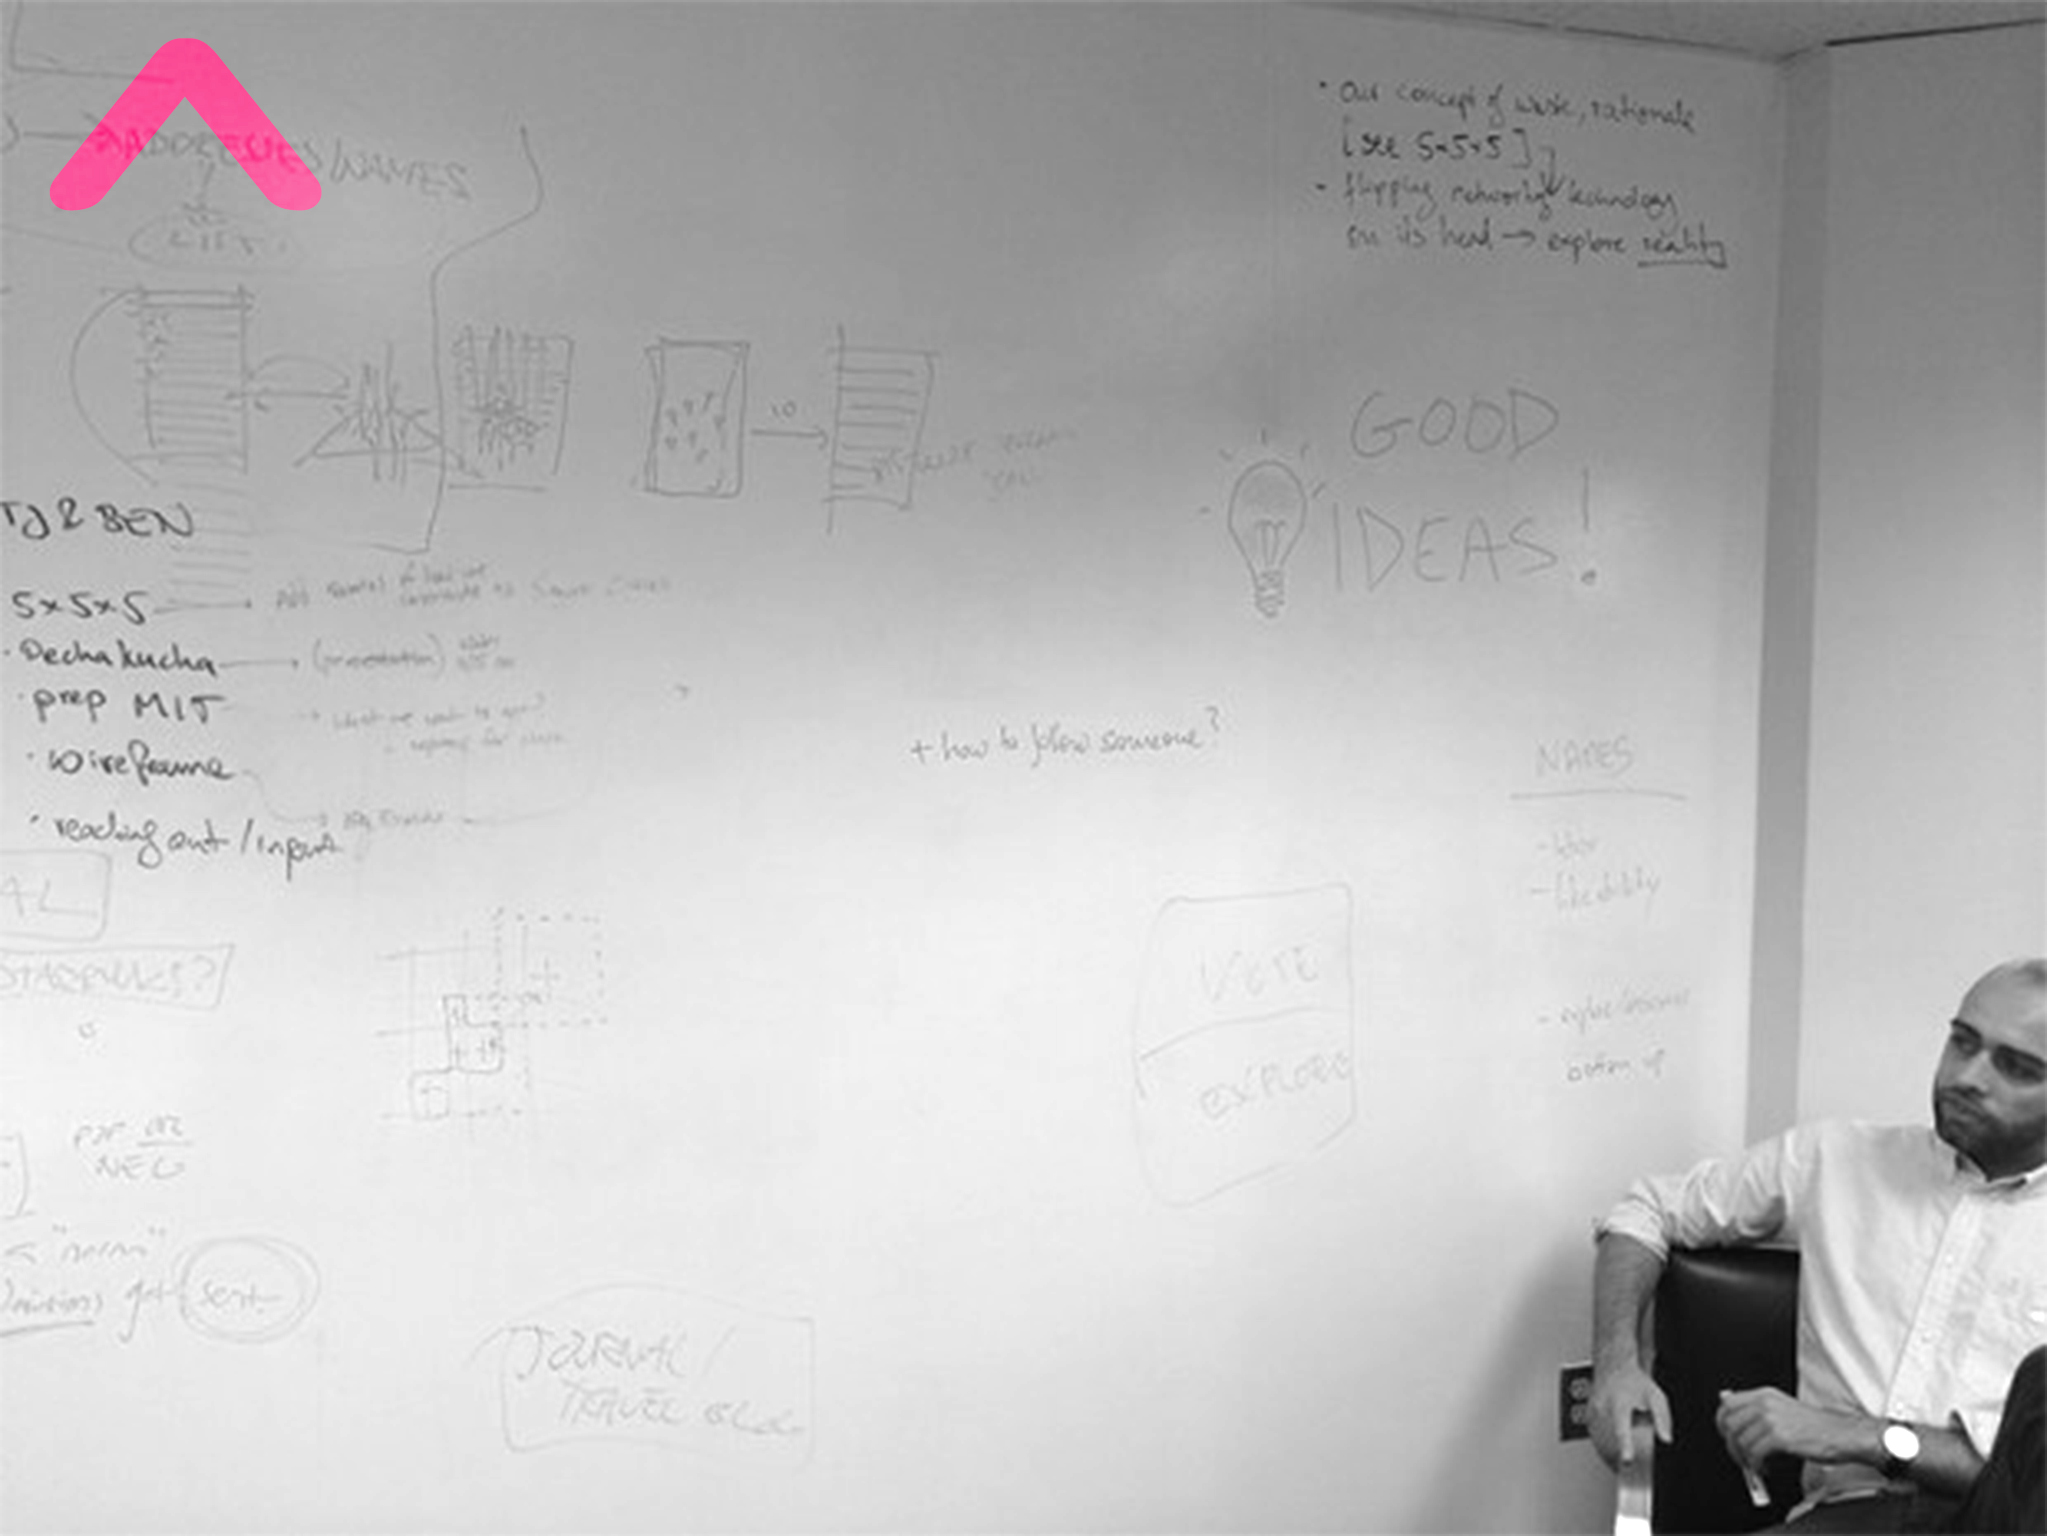
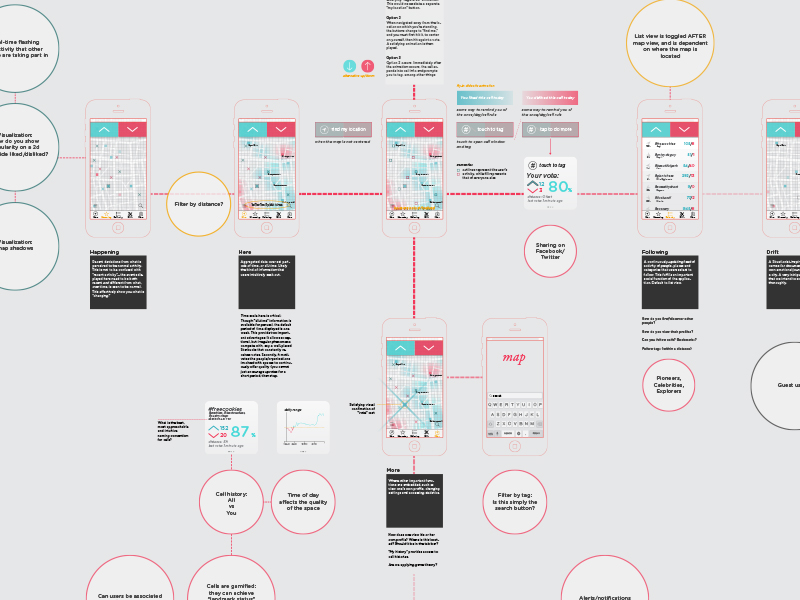
The first week of the project can be described by google doc, erase, google doc, erase, google doc. We collectively pondered about the base line rationale and narrative of the project. Later that week, we took the same process to the walls: idea paint, wipe, idea paint, wipe, idea paint… We drew up wireframes and had them dictate our thinking as to how the user interface needed to perform.
Scott Liang | TJ McCourt | Benjamin Scheerbarth
Scott Liang | Benjamin Scheerbarth
Today’s highly connected world has enabled new forms of communication that have heretofore been impossible. Platforms such as Facebook, Twitter, and Quora allow us to connect with our friends, followers, or people of shared interest, essentially without regard for their physical location. These new forms of interaction are invaluable in their ability to target a very specific audience in ways that are difficult or impossible without current technologies. But while these technologies have largely erased spatial barriers, its potential for facilitating proximal interactions has been left largely unexplored.
What if there was a platform where we could easily share photos and have discussions with fellow event-goers with whom we share our current location? What if this platform could let us talk to our neighbors about community news, ask about a lost pet, or put an item up for sale? What if this platform could allow a new tenant to ask existing residents about move-in advice?
Despite the tremendous value in locally-targeted communication, there is as yet no dominant platform through which to do so. Services that connect you with your residential neighborhood do not allow you to engage with people outside of its boundaries. Services that let people to post in predefined public places do not reflect the users’ sense of place. Services that allow people to post geolocated messages via their physical location do not capitalize on the inherent advantages of the digital medium to transcend spatial restrictions.
For these reasons we decided to develop our own solution:
![]()
Hear Here is a location-based discussion board that allows people to connect with each other through the commonality of place. It allows users to engage in threaded discussions that are linked to locations around them. Nearby discussion threads are displayed based on the user’s physical location. Users can also view discussions in other places by moving their virtual selves to that location. These discussions are persistent—they can be viewed and continued by future users even after the original participants have left. Hear Here is designed to foster both local community and provide an avenue for transient populations to engage with locals and with each other.
Hear Here is entirely user generated. Its users create both the content and the geometry of the places to which these topics are tagged. These places can range in scale from a single building up to a city district. A place can be as well-defined as a building or as nebulous and transient such as an impromptu street festival. And because these places not defined by top-down categorizations, Hear Here can provide insights into how people truly conceive of place.
Hear Here can be understood as a conciliation of the digital layer with the physical world. Discussions, conversations, and thoughts are mapped to a virtual representation of real space. Hear Here is still cyberspace—you are free to move your virtual location wherever you want—but it straddles the digital/physical divide in a way that marries the qualities of both kinds of space. It liberates real world users from physical restrictions by allowing them to engage with others at any place and any time, yet it still retains the real world spatiality that is valuable for targeting users. This spatial duality is still a novel and under-explored conception, but we are excited to see how people utilize it in ways we cannot yet imagine.
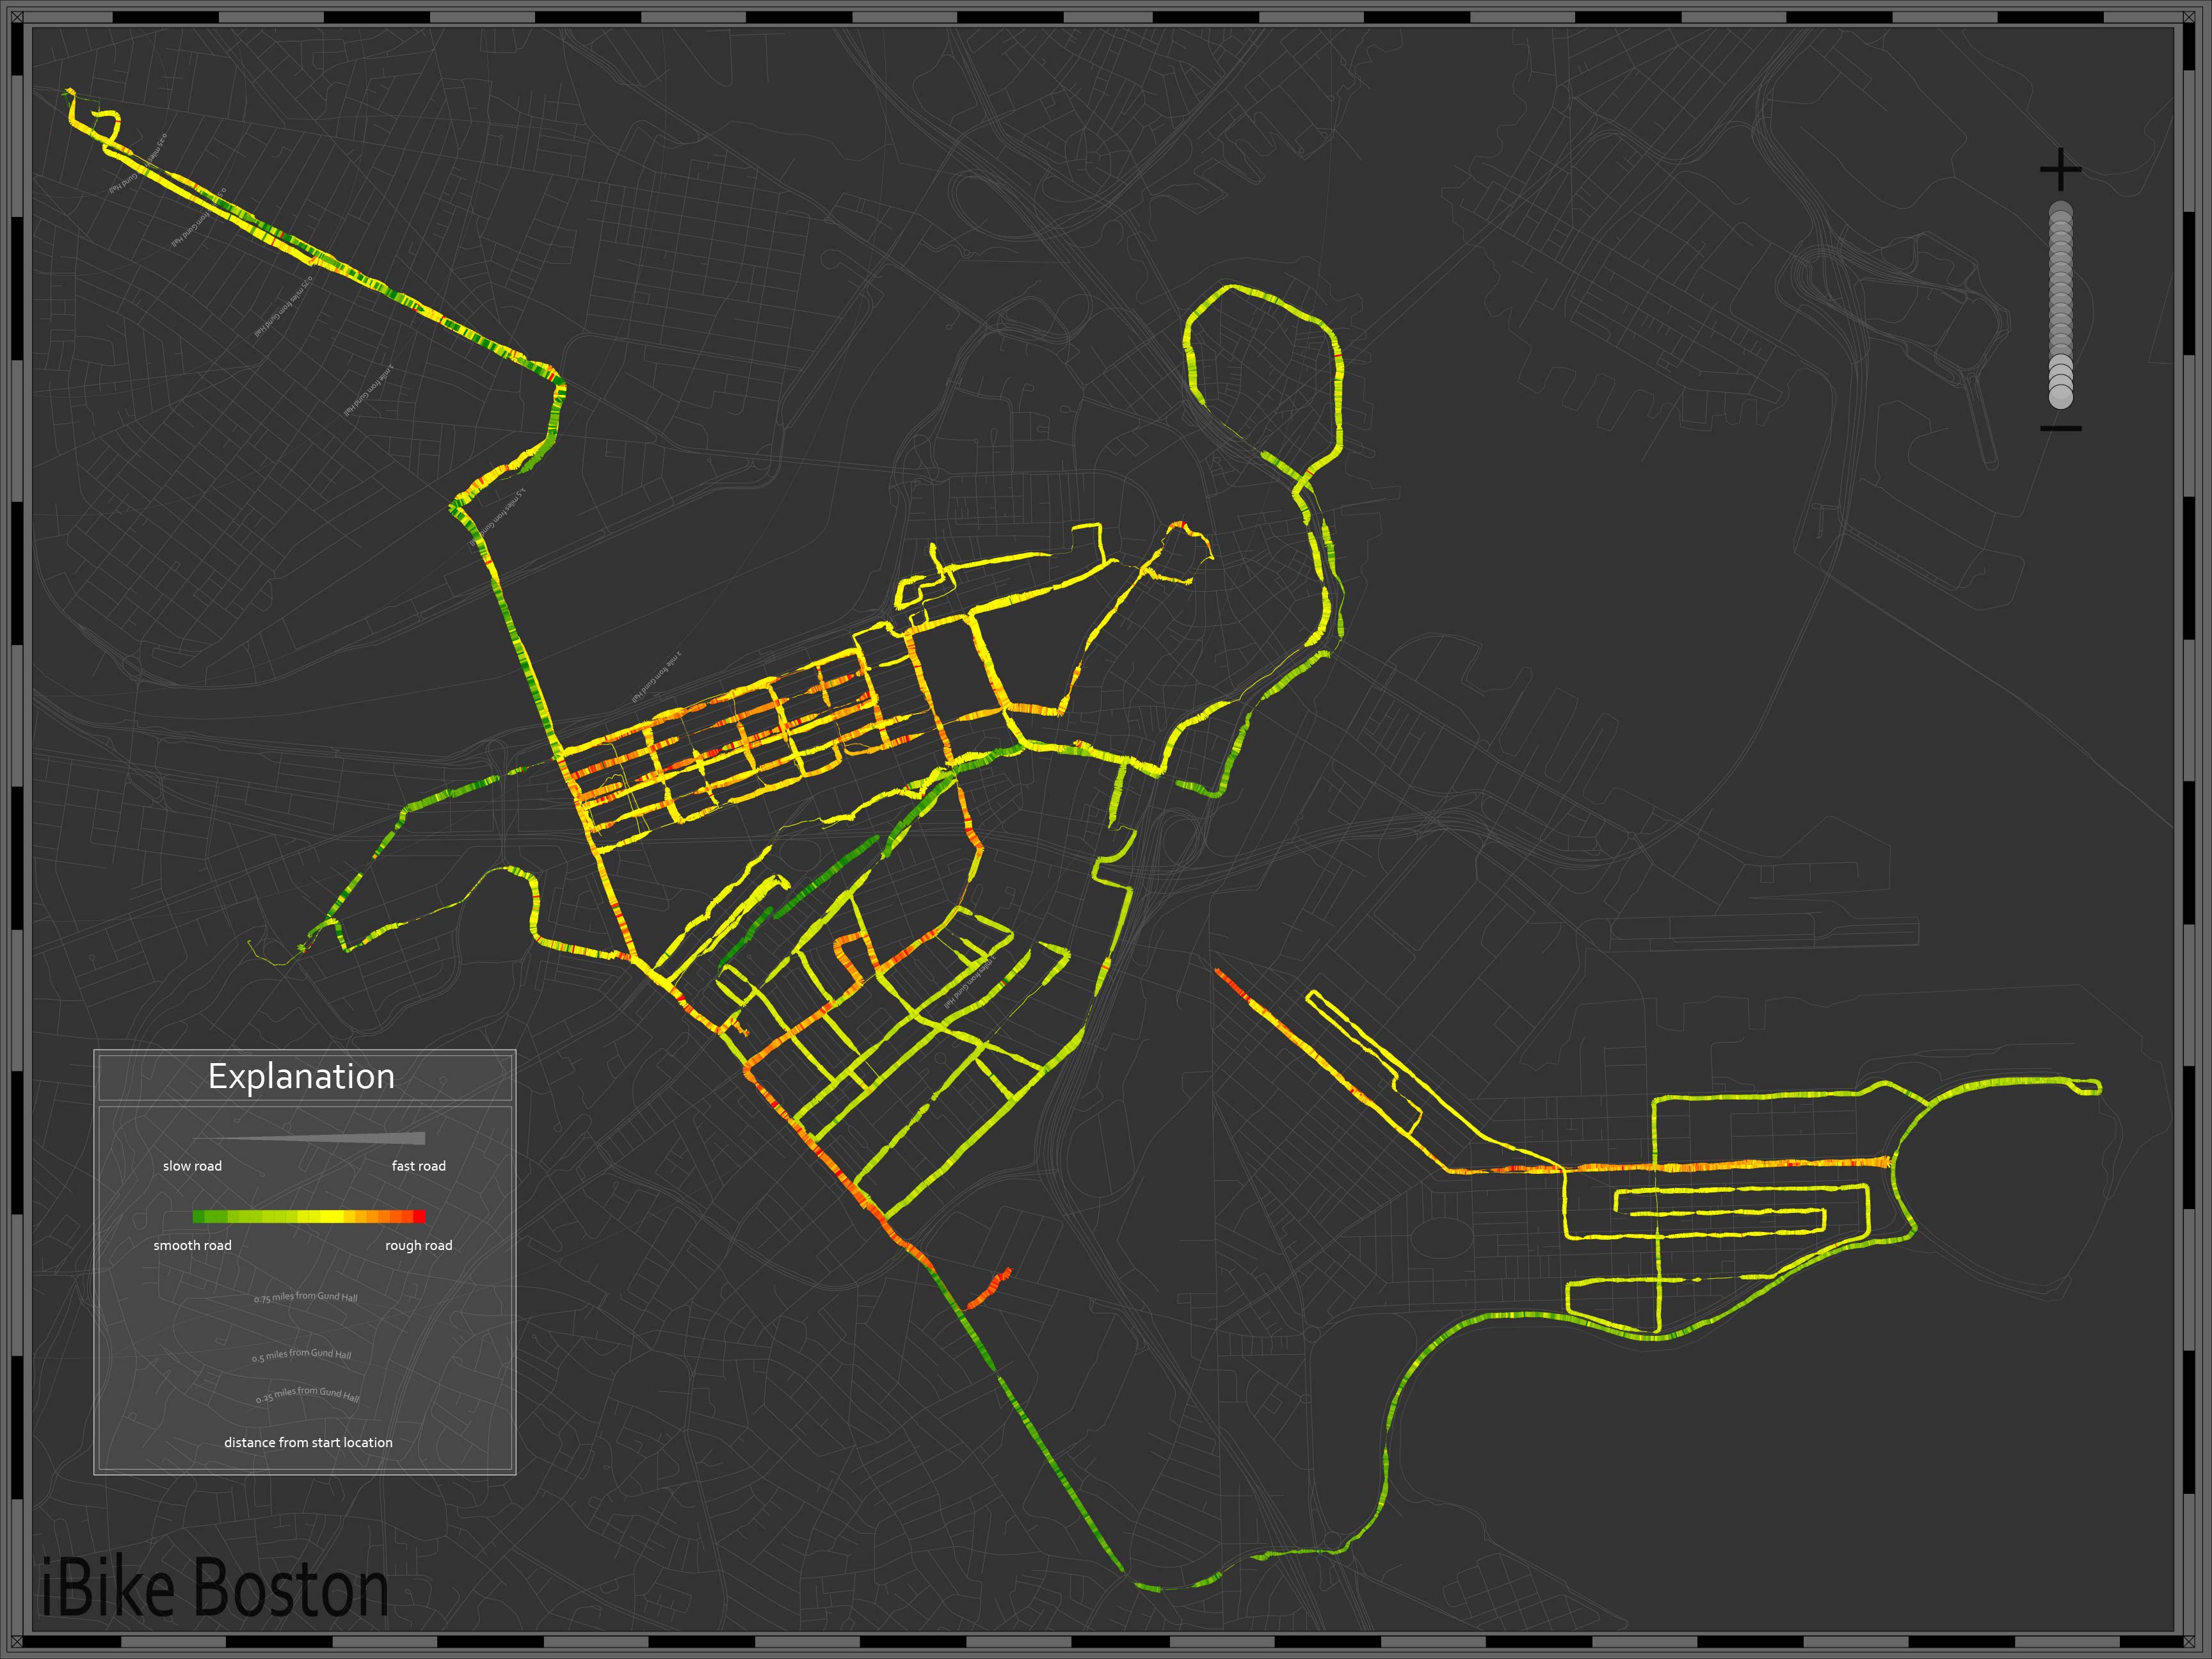
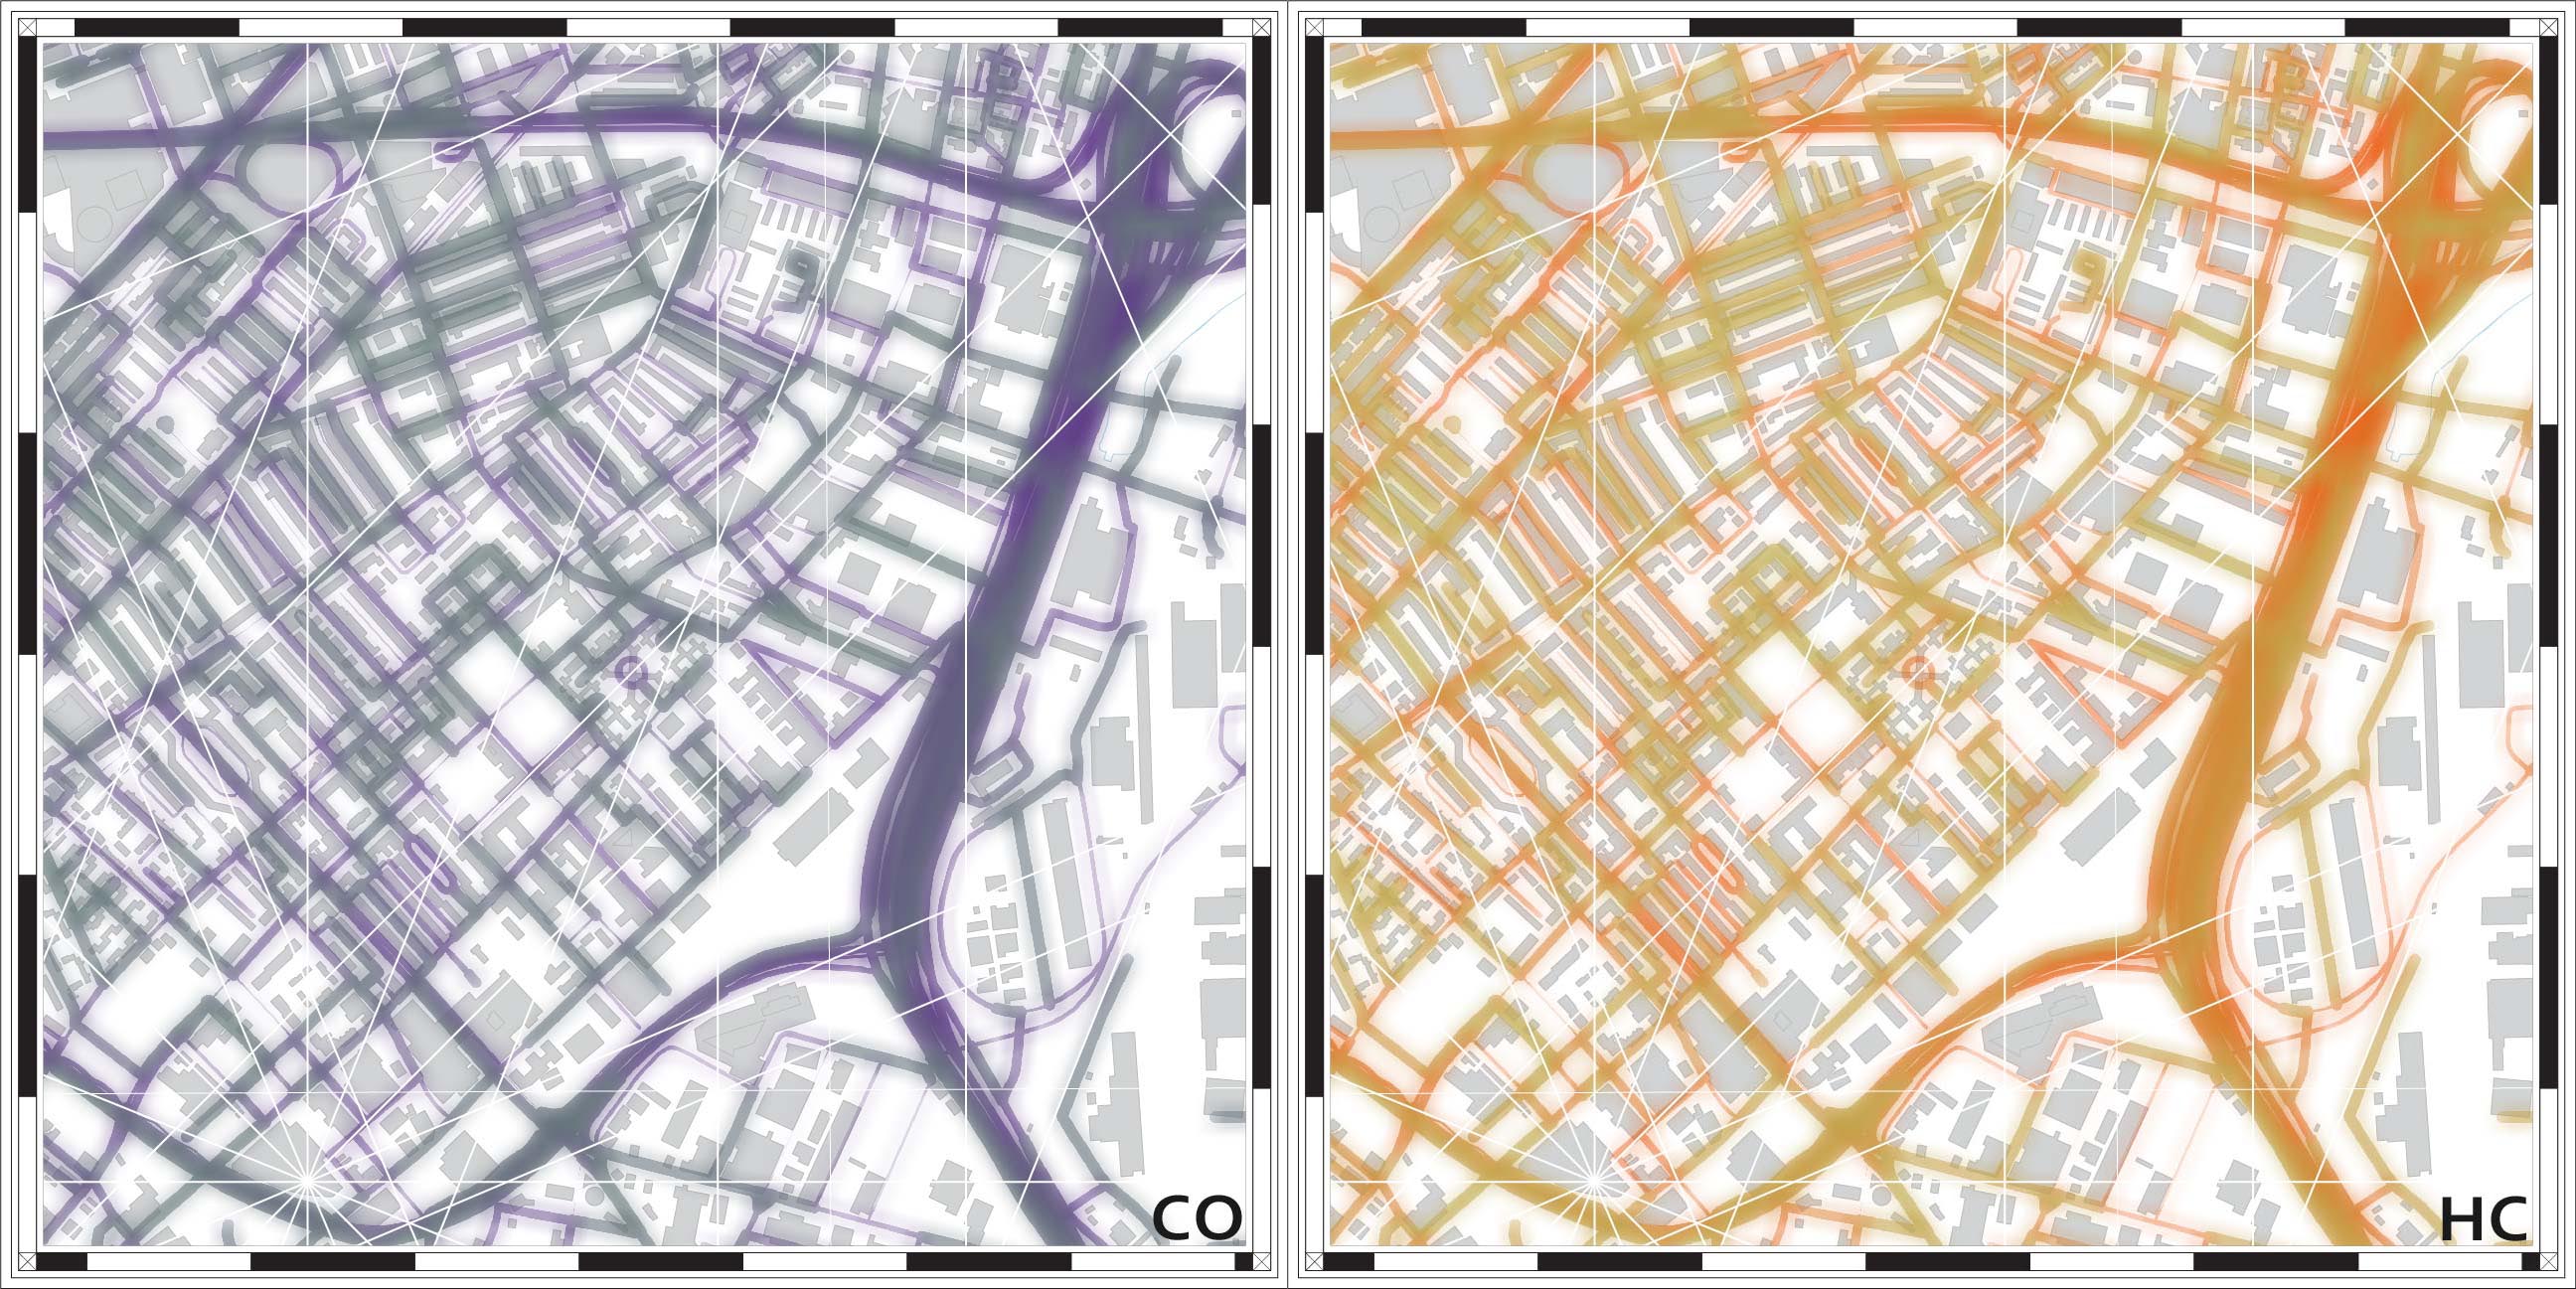
iBike, questions both the data collection as well as the dissemination. By mounting specific sensors to a bicycle data was collected in an effort to draw the experience of cycling in Boston. Using an accelerometer to measure micro-topography and a GPS to geo-locate the information and to provide speed data, I am questioning the existing maps by redrawing the city based on the experience of cycling. The width of roads is drawn based on the speed of travel (faster roads feel wider) and the micro-topography is drawn by increased density of marks when viewed at the neighborhood scale and as a color gradation at the larger scale. The resulting maps provide the cyclist with a layer of information absent in existing cycle maps that relates directly to the human experience.
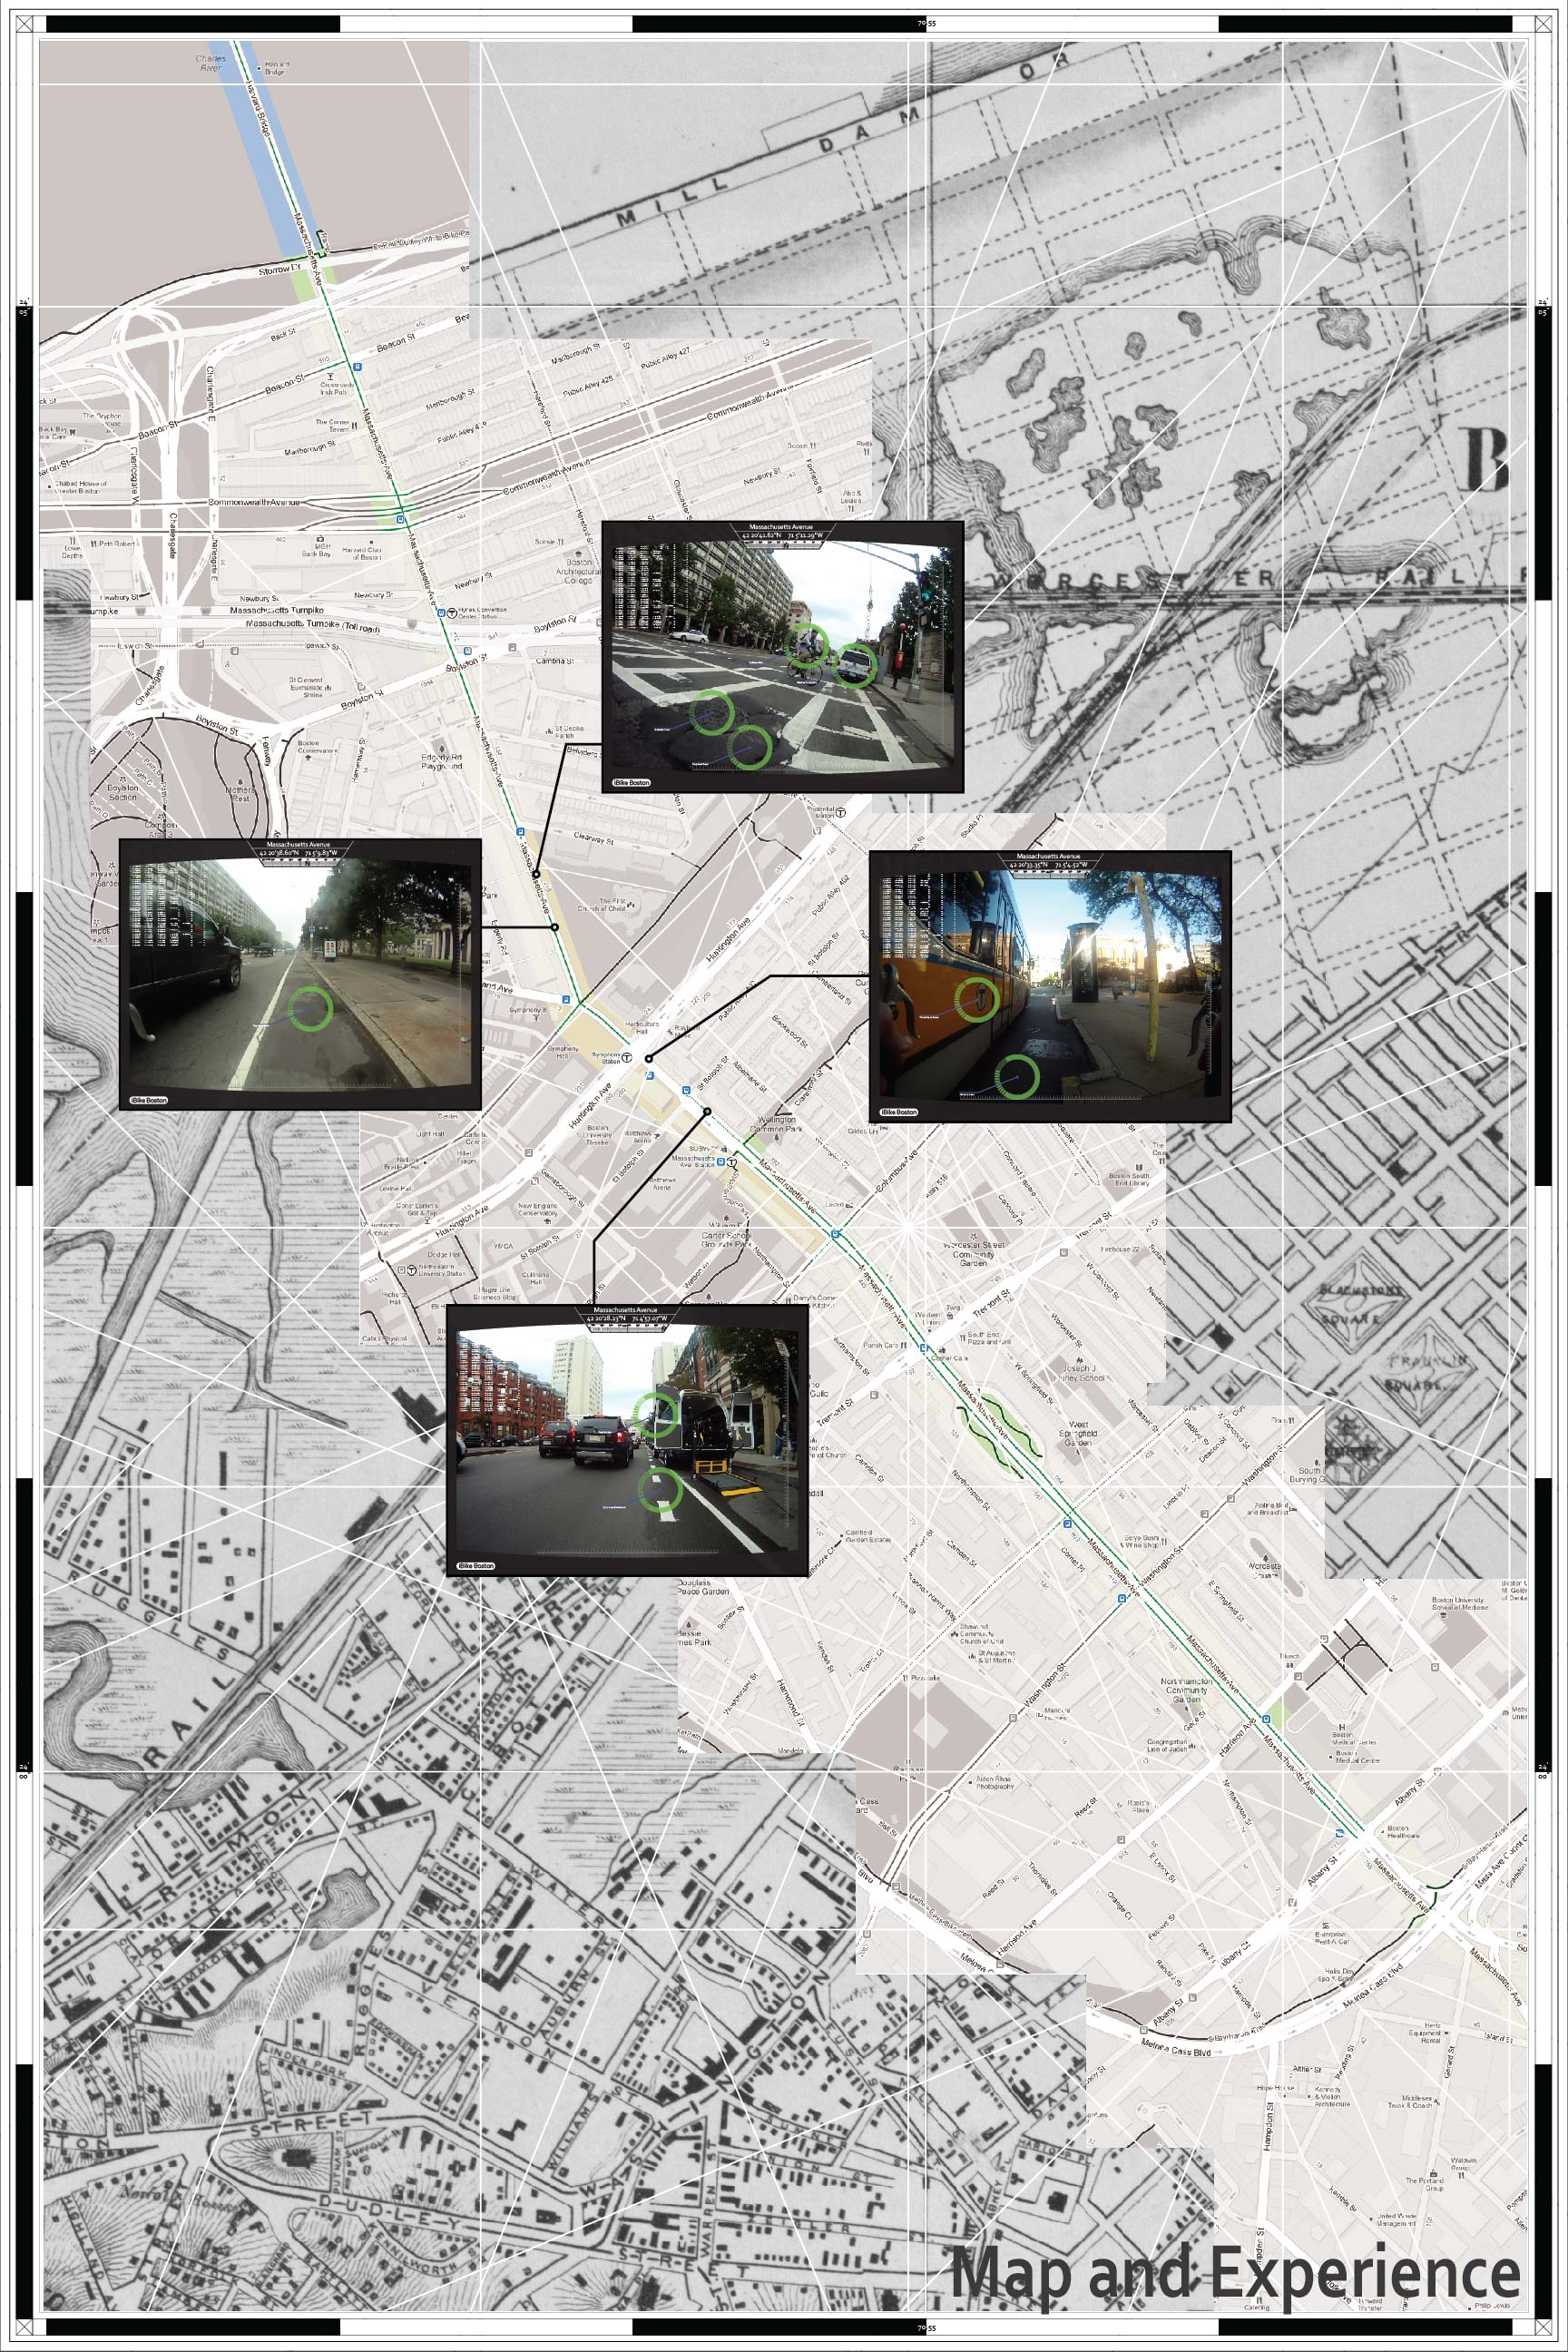
iBike Boston began with a simple proposition, go out and explore Boston, discover the city. This seemed a funny proposition as Boston is my home, where I have lived and worked for eight years, having grown up in a smaller city fifteen minute to the south. Accepting the challenge of discovering my city I decided to take my bike and ride around the residential part of South Boston. I have spent quite a bit of time in Southie, but always along the water or along Broadway, the main street running through the middle. What I found was that it was nearly impossible to get from my appartment in the South End to South Boston, a distance of only about two miles. Though Boston has been making great moves to become a more cyclable city, there exist still major gaps in the infrastructure and linkages. The two mile ride to Southie bring you across a four lane intersection and on ramp over the highway and around a major rotary, the way back sends you under the highway where no cross lanes exist.
This adventure got me thinking about how different the rhetoric about Boston being a more cyclable city is from the actual experience of riding. I began looking at maps, both cycle specific as well as common digital maps. The cycle maps that if found provided little information on what the surficial conditions actually were. Cycle lanes, when represented at all, were color coded lines drawn over centerline of streets, simply denoting that a cycle lane exists with no hint at the quality or width of the lane, just a demarcation of it’s existence. The base maps that the diagrammatic overlays were applied to are similarly simplified, seemingly dependent on satellite imagery to provide any “real” surficial information.
The ubiquitous google map that everyone is familiar with stands as a contradiction to the access of huge amounts of data. The flattened surface of the “map” view juxtaposed with the satellite imagery layer are presented as a complete picture of the world, encompassing all of the resolution necessary. With this dichotomy of the ultra simplified map and satellite imagery a certain thickness of information that had been drawn into maps for centuries has been wiped away. Further, the ubiquity of data collection devices (smart phones with gps, etc.) bring to question why modern cartography has largely been simplified (perhaps because of the ubiquity of data collection and dissemination).
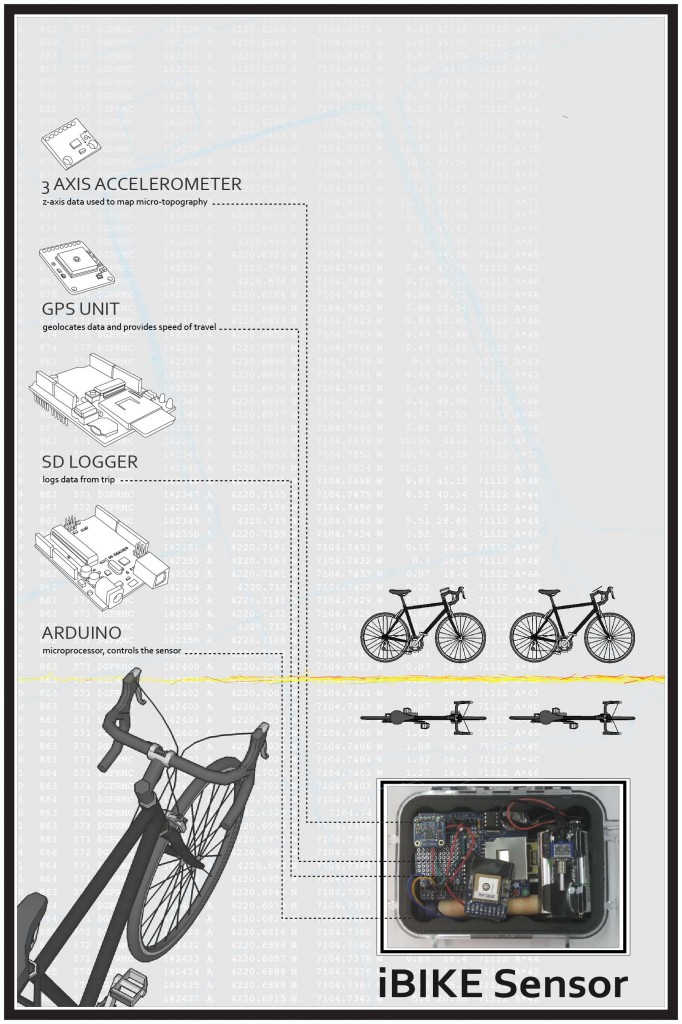
From this research I decided to explore how a thicker more informative cycle map could be drawn, to remap the city drawing the experientiality of cycling. To do this I built a sensor to mount to my bike in order to map data related to the experience of the ride. I focused in on two parameters to map, micro-topography and speed. I used an accelerometer to map the micro-topography; using the z-value from the inertia sensor I was able to map the feeling of the road while riding. A GPS was used to geo-locate the information and to provide speed data. The width of roads is drawn based on the speed of travel (faster roads feel wider) and the micro-topography is drawn by increased density of marks when viewed at the neighborhood scale and as a color gradation at the larger scale. The resulting maps provide the cyclist with a layer of information absent in existing cycle maps that relates directly to the human experience. The limited parameters of micro-topography and speed provide quite a bit of information pertinent cyclists, as the yare two major factors in the comfort of a ride. Additionally the use of the accelerometer and GPS allows for future scalability as most, if not all, smart phones have these two sensors built in. With the intention of turning this into an app crowd-sourcing data iBike can redraw the city based on the experience of cycling temporally, showing conditions as they change. The maps have the ability to transition as road change, construction begins and ends, even diurnal maps can be created so that the cyclist can better understand what the riding conditions are likely to be when they set out.
![0.18_Park_1 [Converted]](http://networkedurbanism.com/wp-content/uploads/2012/12/Park-and-Back-Bay.jpg)
Developing into the future I am looking to formalize iBike Boston into a crowd-sourced digital mapping system, drawing thick user based maps that redraw the city based on experience. Additionally I am developing sensor packs to measure other inputs that affect the quality of cycling. By collecting and mapping this data I am looking to impact the way we urbanize our city and environs, the city exists as a system of people, not of cars and our infrastructure should reflect that.

« Previous 1 2 3 4 … 6 Next »