Networked Urbanism
design thinking initiatives for a better urban life
apps awareness bahrain bike climate culture Death design digital donations economy education energy extreme Extreme climate funerals georeference GSD Harvard interaction Krystelle mapping market middle east mobility Network networkedurbanism nurra nurraempathy placemaking Public public space resources Responsivedesign social social market Space time time management ucjc visitor void waste water Ziyi

education
Using education to empower citizens and make them more proactive. Can we use education, as one of the most powerful drivers of change, to change the role people we take in urban development, showing them new resources and tools for change and action?
Continuing research into new types of technology to transform the visitor experience:
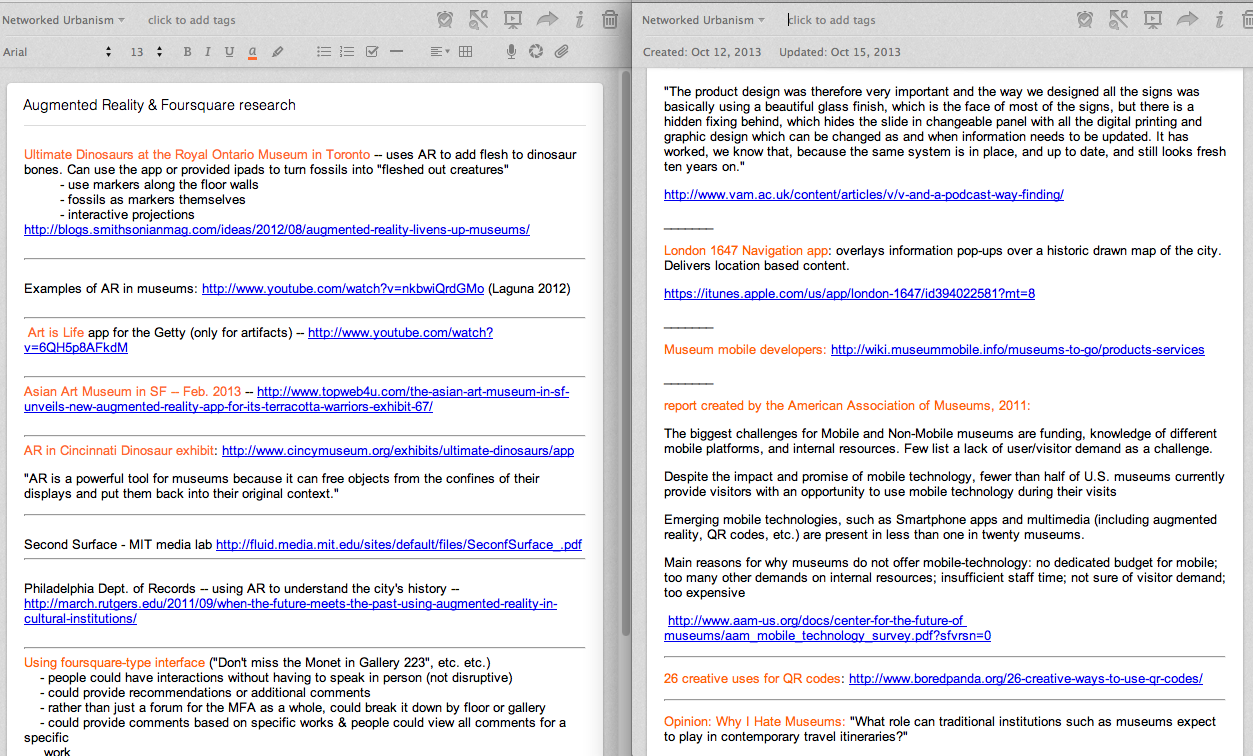
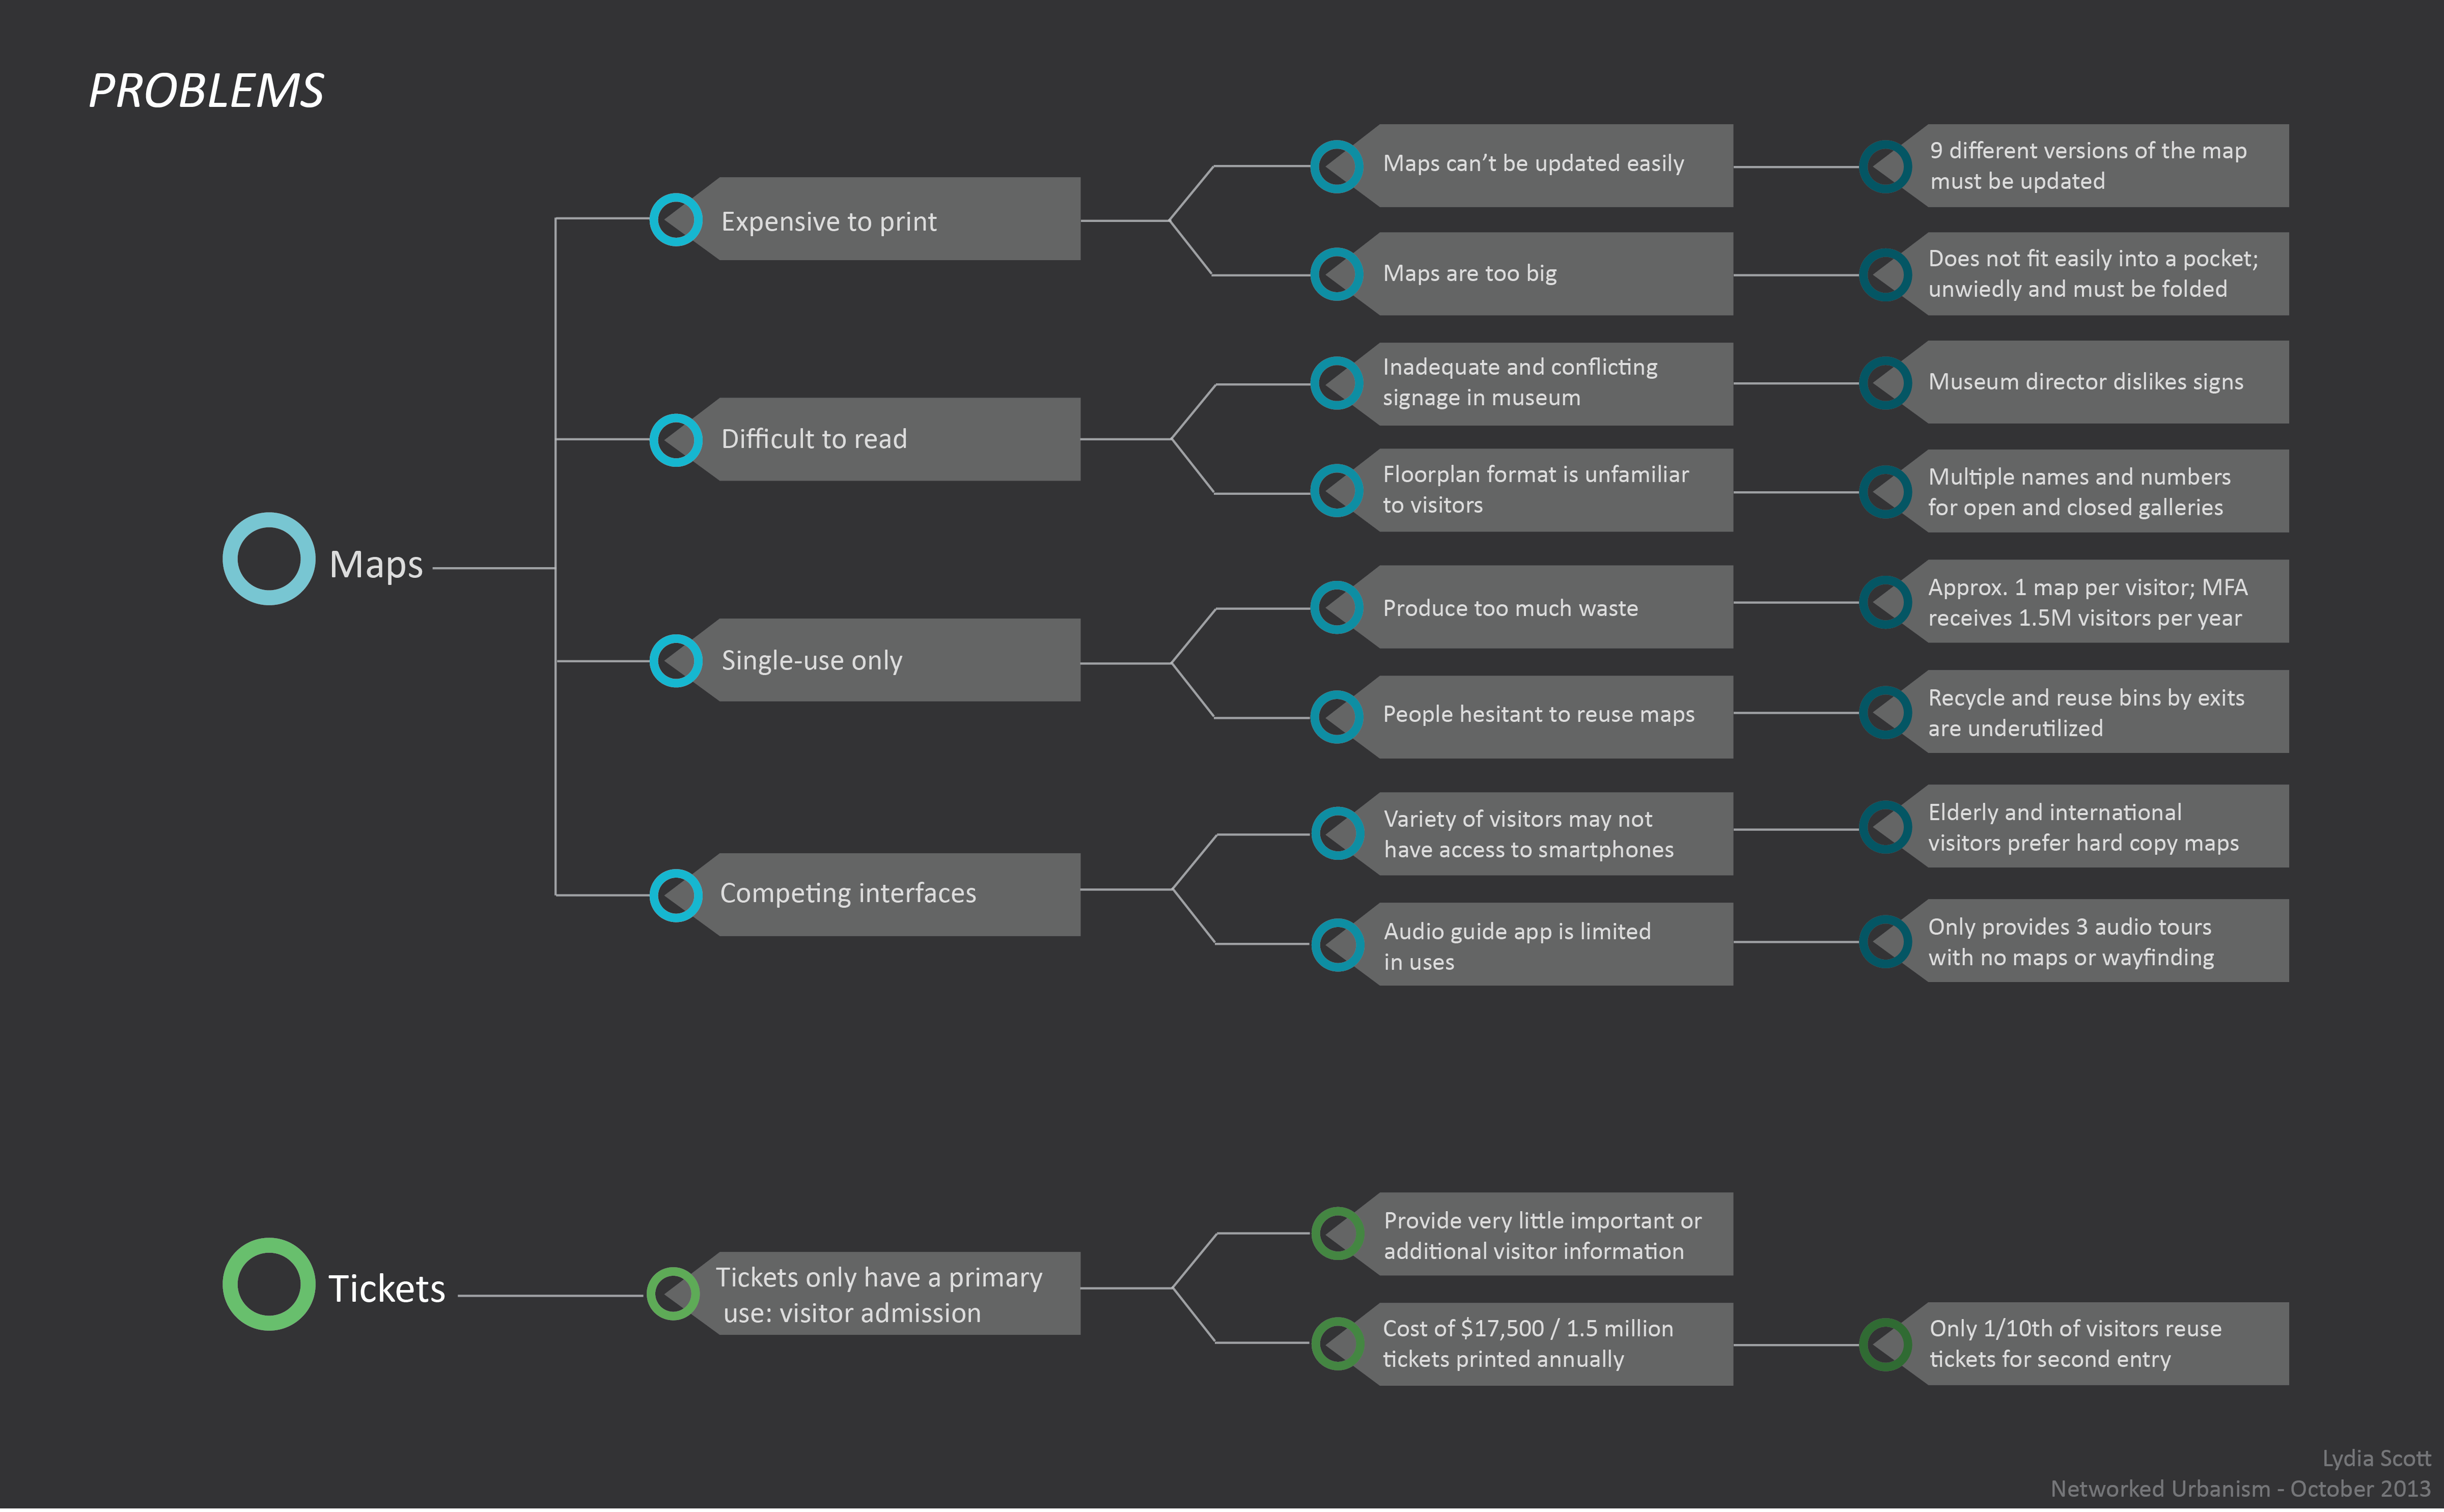
Further mapping of issues with the museum’s current paper-based tickets and maps:
Initial exploration and proposals for paper items offered for museum visitors:
Research Presentation 10.01.13
Bringing a bit of the museum to class, instead of bringing the class to the museum.
10.01.13 Experience Presentation
Habit ED – Jean You and Natalia Gaerlan
If children are taught to recycle in the educational system through fun methods such as games, reward systems, and educational toys, then good trash habits can be established early. These habits will not only be passed on to future generations, but also encourage parents of the current generation to change their trash habits.
Bostonians, through their water usage, are one part of an extensive, connected system. The delivery of water to and from your home comprises of more resources than water alone and results in large scale infrastructural interventions that shape our landscape and impacts ecosystems on both sides of the chain. Through exploring methods of communicating these concepts, I hope provide a tool that educates users as to what resources go into the treatment and transport of water, how they’re using water in their homes and why it’s important to conserve it.

“Know Your Water” came out of an interest in the hidden infrastructure of the city. Cities have complicated networks of resources that lie beneath them and only through the occasional clue, such as a manhole cover, are we even aware of their existence. Water, electricity and gas all appear at the click of a switch as if by magic; their supporting infrastructure only questioned when there are problems. I was particularly interested in the water network of Boston due to the sheer size of its supporting infrastructure. Reservoirs and aqueducts are incredibly large interventions and Boston has one of the largest man made reservoirs in the world. How have these massive landscape interventions been so successfully removed from our consciousness?
The first half of the semester was devoted to demystifying the water network, understanding all of the pieces of the potable water system from collection to use with the ultimate goal of targeting issues within the system that need to be communicated to the public. Since people tend to be very proactive about pushing for improvements in visible infrastructure such as streets, I hoped that I could help encourage them to take an equal interest in their water infrastructure and push for improvements in the aging underground networks.
Through research and interviews I realized that most of the issues in the Boston area lie not within the potable water networks, but post-use in the sewers. For example, combined sewer/storm water overflow pipes are driving the design of our sewer systems and waste water treatment plants, causing major inefficiencies in the system except during large storm events. Additionally, due to old pipes, clean water is infiltrating into the sewers which, combined with a largely impervious surface, are lowering the ground water level causing historic wood pilings in buildings. However, the most essential piece of information I found was that the knowledge gap between the user and the water system is at a very basic level. Partially due to the abundance of rain in the region, clean water is majorly undervalued and many users don’t understand why they should conserve it or even pay for it.
Currently, the average person pays only 1 to 2 cents per gallon for tap water in the Boston metropolitan area. Considering that as our population grows water is only going to get scarcer and prices cannot remain so deeply subsidized indefinitely, the goal of the project shifted to address the education of the average user towards the larger infrastructural, resource and ecological requirements of water usage.
The infrastructural requirements to provide water to the entire Boston metropolitan area are obviously quite extensive. There are three water sources feeding the system: the Quabbin Reservoir, the Wachusett Reservoir, and the Ware River. Much of the land that drains into these sources, especially the Wachusett and Quabbin, is protected and came at the cost of displacement of multiple towns. Additionally, the water travels at least 80 miles from collection to ocean release in pipes that range from 4 inches 23 feet in diameter.
There are also many other resources required in this process. A huge amount of energy is necessary to pump and treat waste water and despite many efforts to use renewable resources as often as possible by the Massachusetts Water Resources Aurthority, 84% of the energy they use is still coming from power plants. There are also several chemicals that go into the water treatment process, disinfecting and altering the water composition.
Perhaps most importantly, the understanding that our water usage is part of a larger, connected system is crucial. Our use affects ecosystems on both sides of the chain, and if the awareness of where our water will go can be achieved, then perhaps we can start to make smarter choices about our usage and what we put down the drain.
“Know Your Water” is not just about the water system alone, but is also an exercise in effectively conveying information. Much of my research is available through various water authorities’ websites but is not presented in an easily accessible format. The process of water usage is complicated and systemic; the typical diagram is not effective at communicating these types of overlapping processes. Through a reiterative method, I used animation as a tool for experimentation in communication. The resulting short animation is hopefully not just explaining the process to users, but by presenting the information in a neutral way, is asking people to have an opinion about it. Working with the water resource authorities to make this film most effective, it would ideally be provided to users at the point of payment online. This animation is only the basic information, leaving many opportunities for the more specific sewer issues to be addressed in accompanying videos.
The carbon counters (in both physical and digital form) are meant to stimulate discussion about carbon emissions and climate change at the school of design. The impact that our buildings have on the environment is an issue that is often glossed over at the school of design as it is in most public discussions. If we want to address our concerns for the environment, issues of climate change need to be brought into our collective consciousness and that starts with raising awareness about own carbon footprint.
Climate change is an issue of global concern, with deep roots connected to everything from aging infrastructures to shortsighted policies and regulations. However climate change is also largely the result of behaviors caused by a lack of awareness about the impact our actions have on the environment. Every time we use our computers, turn on the air conditioning, or take a shower, we are releasing carbon into the atmosphere and contributing (in a small but nonetheless significant way) to global climate change. As a result of this general unawareness, people leave their lights on during the day, turn the air conditioning on high in the summer, and take hot showers longer than necessary – exacerbating the problem of global warming.
This semester began with an assumption that educating the public about the way our built environment works, specifically the way our built environment uses energy and contributes to the problem of global warming, has the potential to correct some of our more problematic behaviors. One component of education is finding ways to visualize the invisible yet ubiquitous energy infrastructure and how that infrastructure operates. The other is to visualize the real-time impact our buildings have on the environment, and in so doing affect the decisions we make regarding how we interact with the built world.
While there are undoubtedly many ways to communicate this information, the studio was an opportunity to experiment with an unfamiliar medium: animation. The first experiment involved an animation describing the movement of energy from the point of resource extraction to the point of consumption (the city of Boston). Since Boston, like many northeastern cities, creates most of its useable energy from burning natural gas, the animation begins in the Mississippi Delta where most of the nation’s natural gas is processed before it travels via one of several large pipelines to the electric generation facility. The fact that Boston relies heavily on natural gas for its electric generation is an important point because it enables one to calculate the amount of carbon created per kilowatt-hour of electricity generated.
This first animation was an introduction to new tools, and new techniques of representation. While it was an informative exercise, it failed to communicate the urgency of reducing our collective energy footprint. The description of resource movement from source to sink was ultimately too abstract and removed from the everyday behaviors of ordinary citizens. Using the lessons learned from this first iteration, the second animation used data collected from actual buildings to concretize what was formerly too abstract.
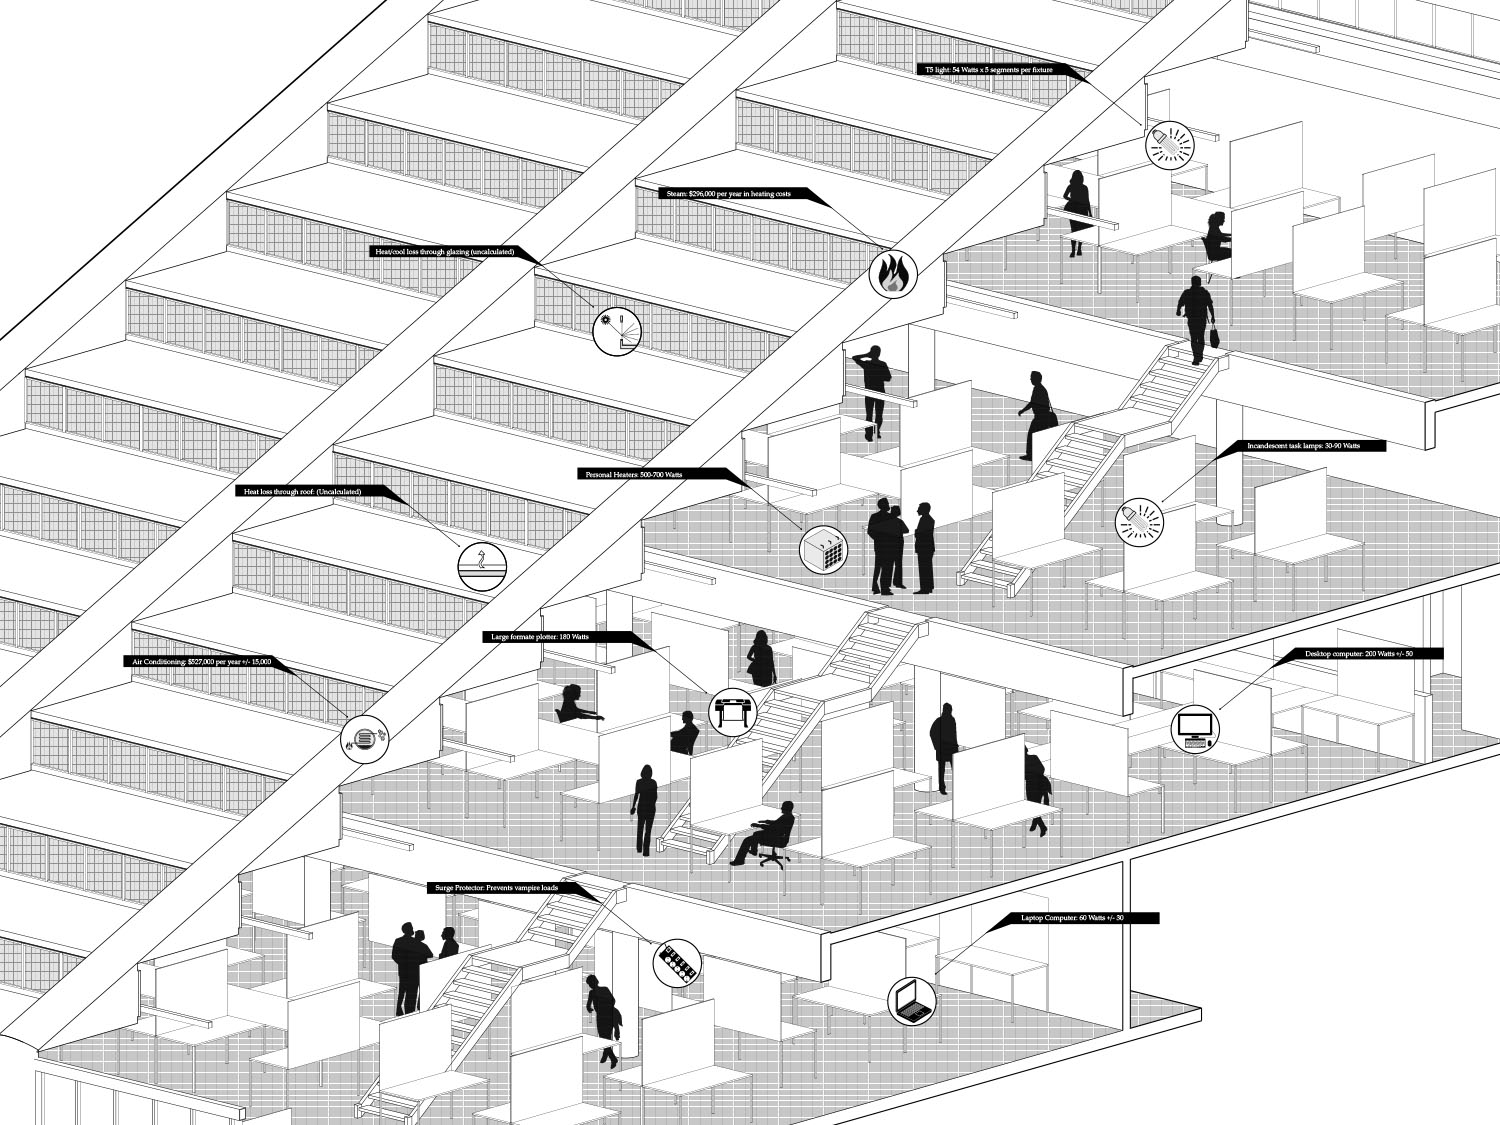
Even with the complexities involved in the processes of energy generation and transmission (deregulated markets, interconnected power grids…etc.) collecting and animating information about how specific buildings or groups of individuals use energy is decidedly more difficult. In order to streamline the research, Gund Hall served as a test kitchen because of their psuedo open data portal to energy monitoring systems. Real-time data on everything from lighting loads to steam use is continuously collected, packaged, and then emailed as a text file once per day. Using this information, the numbers in the animation are presented in traditional terms, such as a Kilowatt-Hours for electricity used for lighting and therms for heating, as well as comparative figures such as number of houses powered per year. For example, the amount of energy used to light Gund Hall is equal to the amount of energy it would take to power 208 medium sized houses. The numbers and figures are also presented in relation to other buildings on the Harvard campus as a way to accentuate the point that Gund uses more energy per square foot than almost any other building in the area except the Science Center (and most of this energy goes toward unnecessarily lighting the building during all hours of the day).
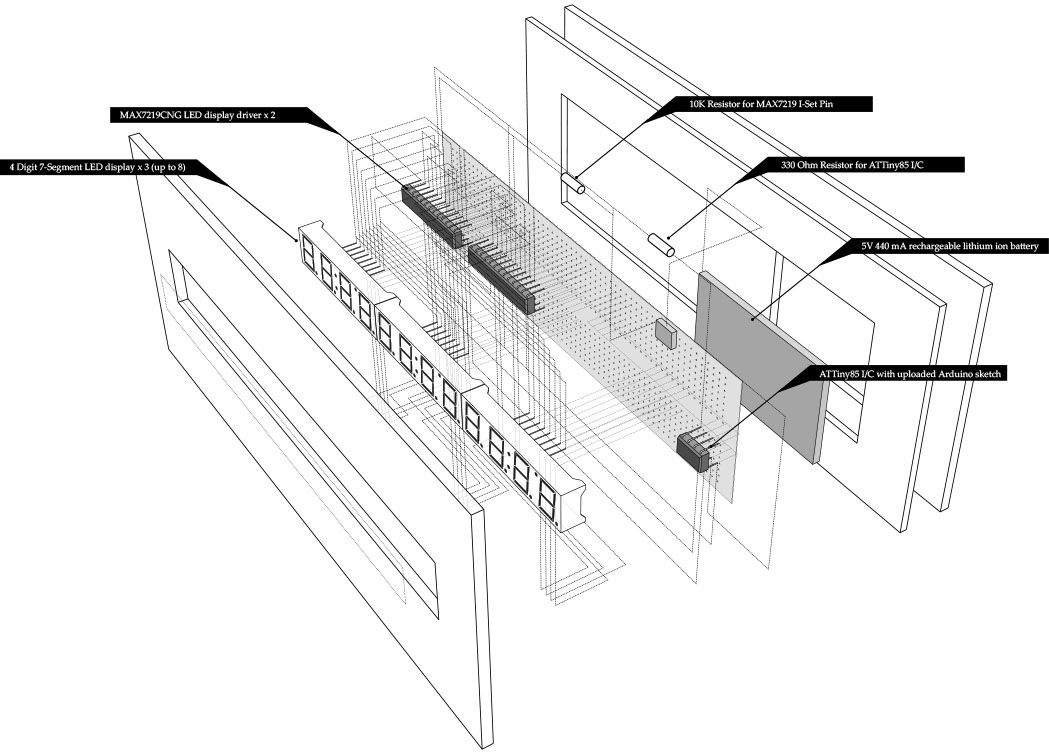
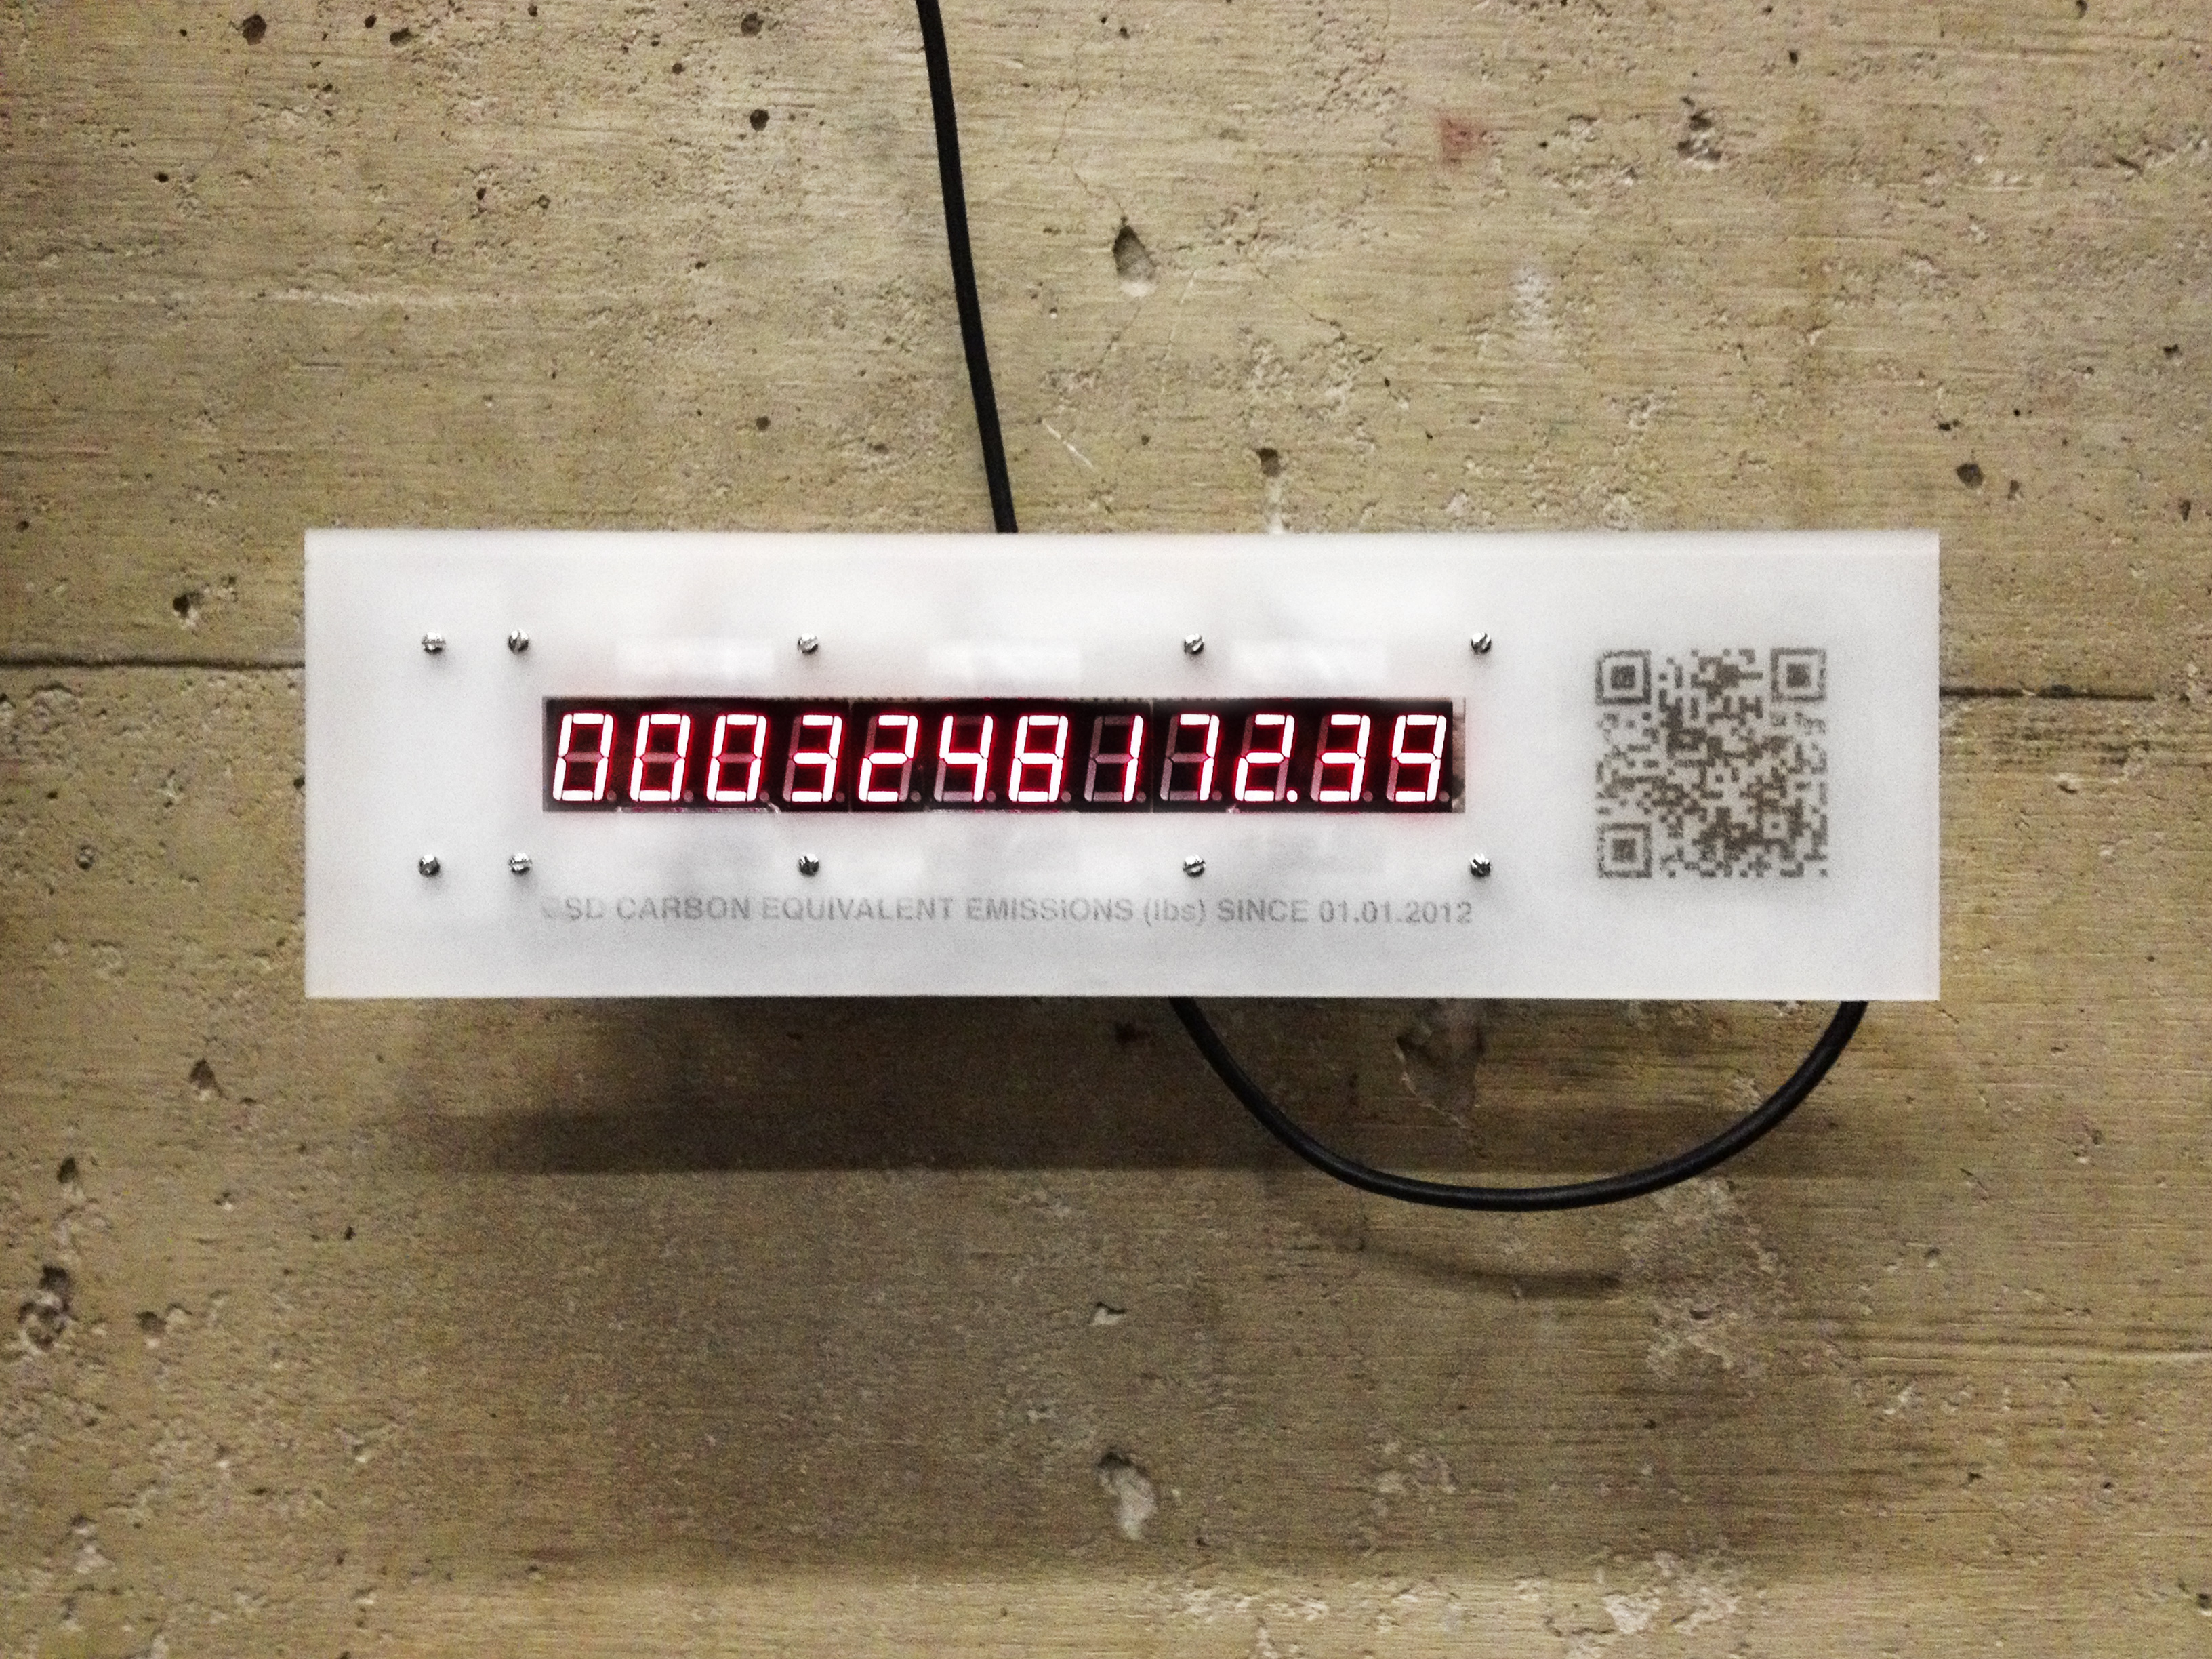
This animation played in the Chauhaus alongside a device that reads the (almost) real-time carbon emissions of Gund Hall. Although the output from this carbon counter is a simple number, the device was designed as an object of intrigue that people could walk up to and investigate – a dynamic and slightly more interactive type of informative poster.
These types of displays are particularly important for the design school, since we as designers are rarely confronted with the reality of how our creations impact the environment. Buildings account for almost half of all carbon emissions in the United States, and designers have a responsibility to create an efficient and responsible built environment. If an awareness of energy use becomes part of our consciousness as designers, and if we are constantly reminded of the ways in which our creations use energy, we are more likely to design and create a better built environment for the future.
FunChinese is a project aiming to connecting people with complementary language skills to share with each other. Through the physical interaction, people begin to gain not only languages but also the knowledge of another culture. More importantly, participants get a natural familiarity with a group of people rather than a single one. And further, this will bring a sense of involvement in the larger community, and more open to new things that one encounters as a new-comer.
Boston has become more and more international. In particular, from 2000 to 2010, the Asian population in Boston multiplied by 1.6. Not only do they represent a minority group of people but also they bring different cultural backgrounds.
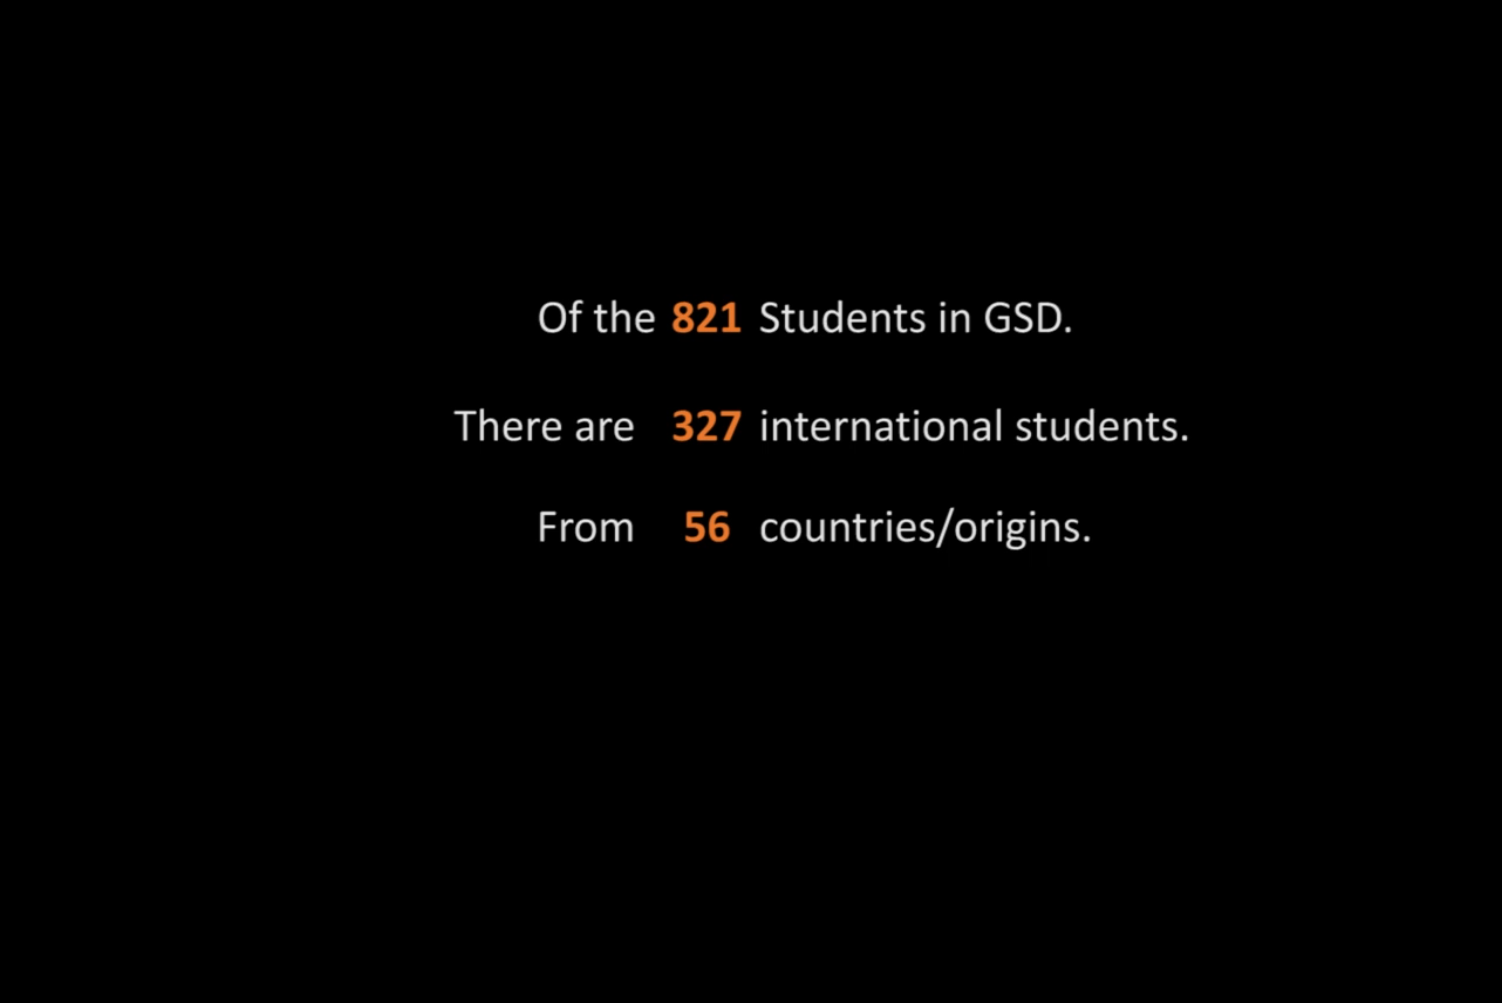
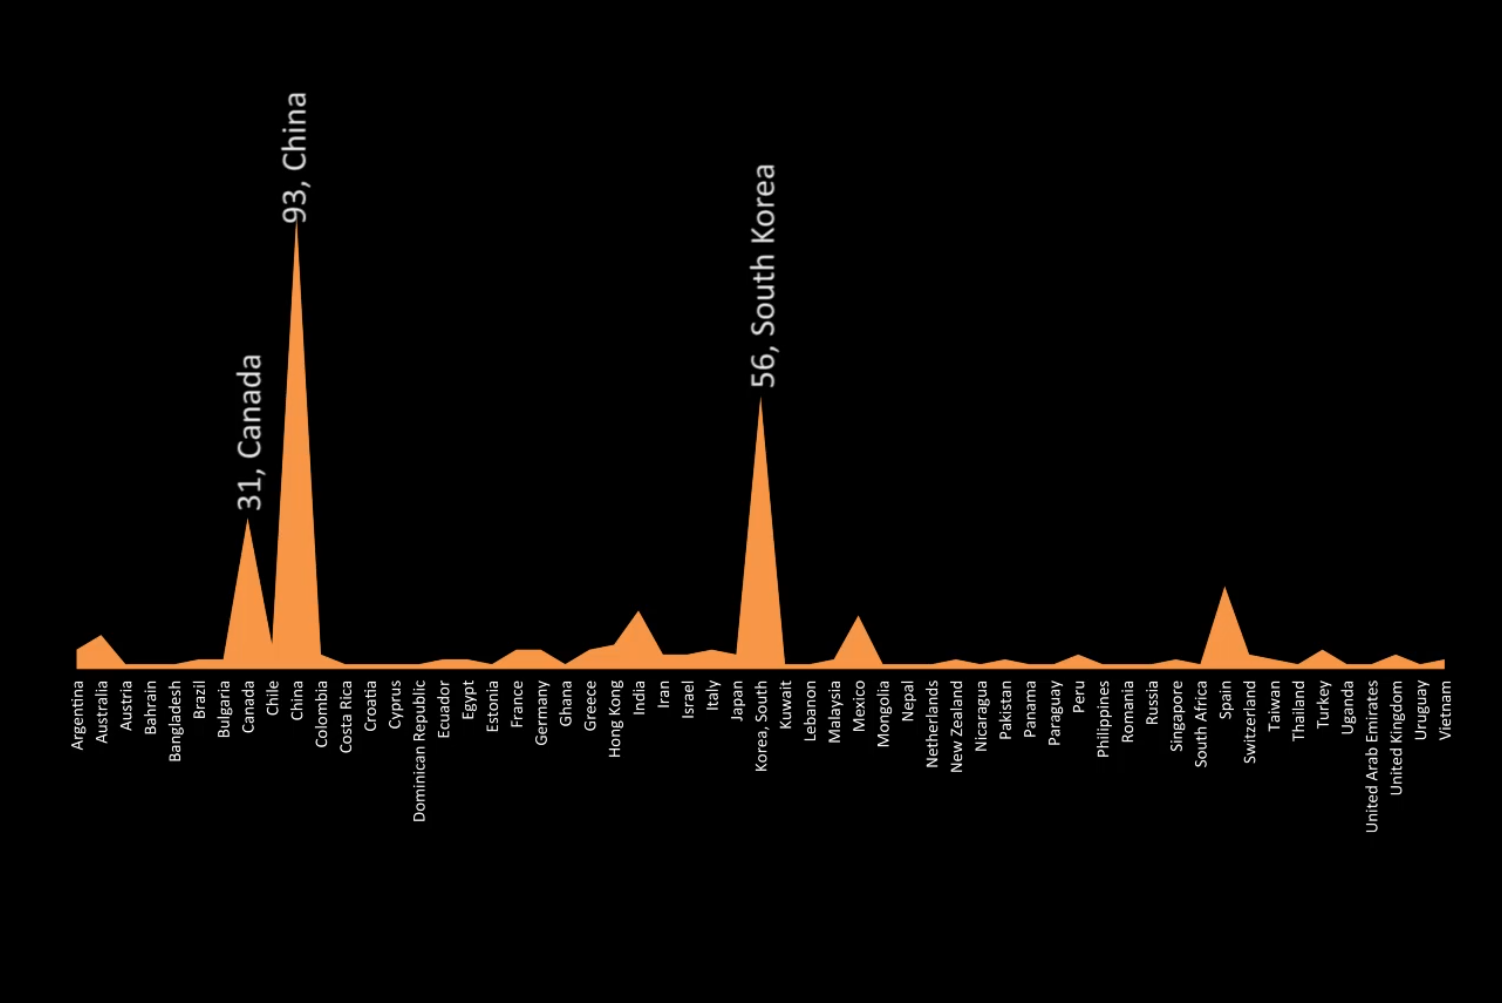
Among the growing Asian population in Boston, international students represent an important group. In the Graduate School of Design, there are 327 international students from 56 origins, which accounts for 39.8% of the 821 students. Among these students, more than 150 are from Asia, mainly China and South Korea. Since the cultural background and mindset of Asian students are fundamentally different from the western world, it is hard for them to adapt into the life in the US.
Some Asian students felt reluctant to speak or make friends. Not because they don’t have the ability to communicate, but because of a natural insecurity in a new environment. On the other hand, international students tend to stick much more to people from the same country.
As the number of international students continues to grow in the GSD and at the larger Boston area, it becomes important to help them better and faster adapt to the new environment. This will benefit international students, and also bring a more healthy and active interaction between all students.
FunChinese takes language as a tool to connect people from distinct backgrounds. Language influences the way different people see the world. It is also a door through which we begin to understand the core of a culture, its ideology as well as deeper meaning. Through the sharing of one’s own culture, students become more open to communicate with peers and thus building a more healthy connection.
International students come from a different culture and are able to bring a diverse insight in a discussion. Especially students from countries like China, South Korea, where there are many developments happening, this cross-cultural interaction could lead to professional practices.
Taking Chinese as starting point, FunChinese takes action by involving students with a Chinese background with students who have interest in Chinese language or Chinese culture, through the form of group meeting and one-on-one interaction. The project starts in the small community of GSD, and then grows in collaboration with the School of Engineering. In the whole process, this project has received highly positive support and response from participants and school directors, and is aiming to continue and expand in the next year.
By contributing to the community, members have benefited from a cross-cultural exchange. Through the weekly interaction, American participants have got the chance to know more about Chinese culture; Chinese participants have been able to engage themselves with the larger GSD community, and found a self-identity as a valuable member with a distinct and meaning cultural background.
FunChinese takes Chinese as a prototype of promoting cultural communication through the means of language.
Boston has become more and more international. In particular, from 2000 to 2010, the Asian population multiplied by 1.6. Not only do they represent a minority group of people but also they bring different cultural backgrounds.
Taking Chinese as starting point, FunChinese is a project aiming to connecting people with complementary language skills to share with each other. Through the physical interaction, people begin to gain not only languages but also the knowledge of another culture. This is a prototype of promoting cross-cultural exchanging.
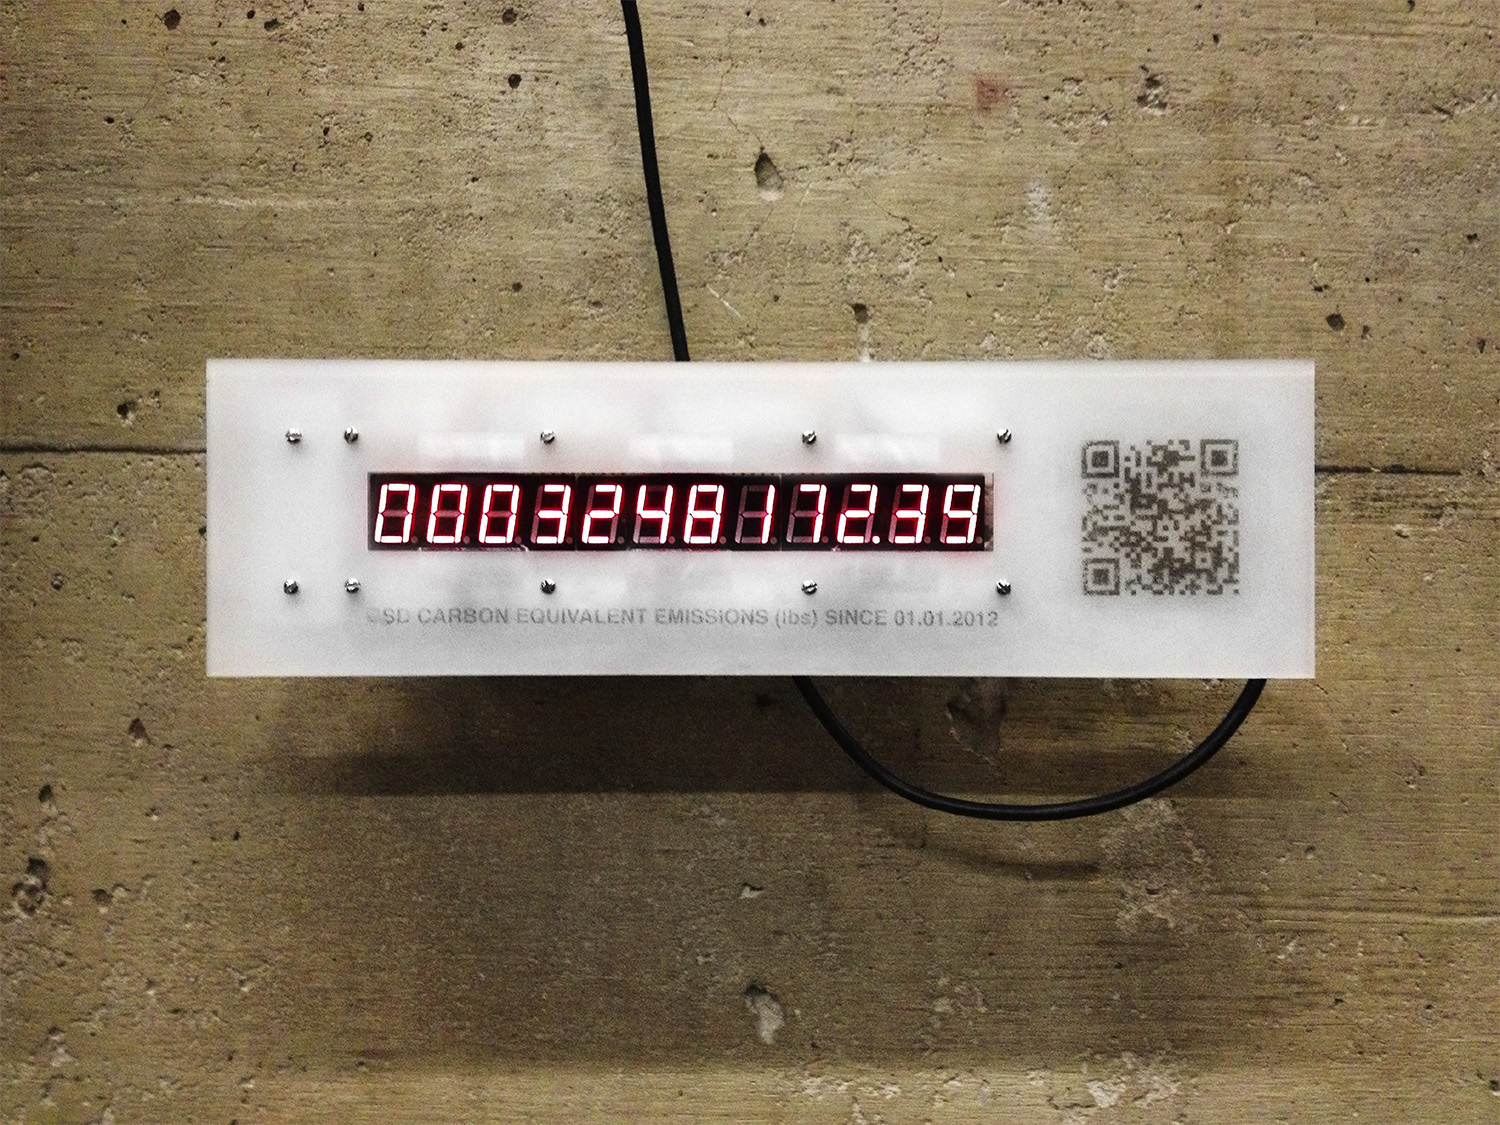
The biggest challenge to reducing our collective energy footprint is visualizing what is normally unseen and forgotten, namely the energy we use everyday. Of course, even if our energy use is rendered as a number, or a graphic, it’s a bit too abstract to actually change our behavior. My initial experiments with this idea led to the development of the carbon counter that is currently displaying the carbon output of the GSD in the Chauhaus. The idea was that people would come up to this object of intrigue, snap a picture of the QR code, and be led to the Architecture 2030 Challenge website (which challenges architects and urban designers to realize net zero projects by t he year 2030). Not surprisingly, this device is pretty hard to miss, so I’m currently trying to think of an installation that will attract more attention to the actual flows of energy at the GSD. The installation is going to be coupled with a brief animation that describes all the ways that the GSD is using energy, and how to improve our collective performance.
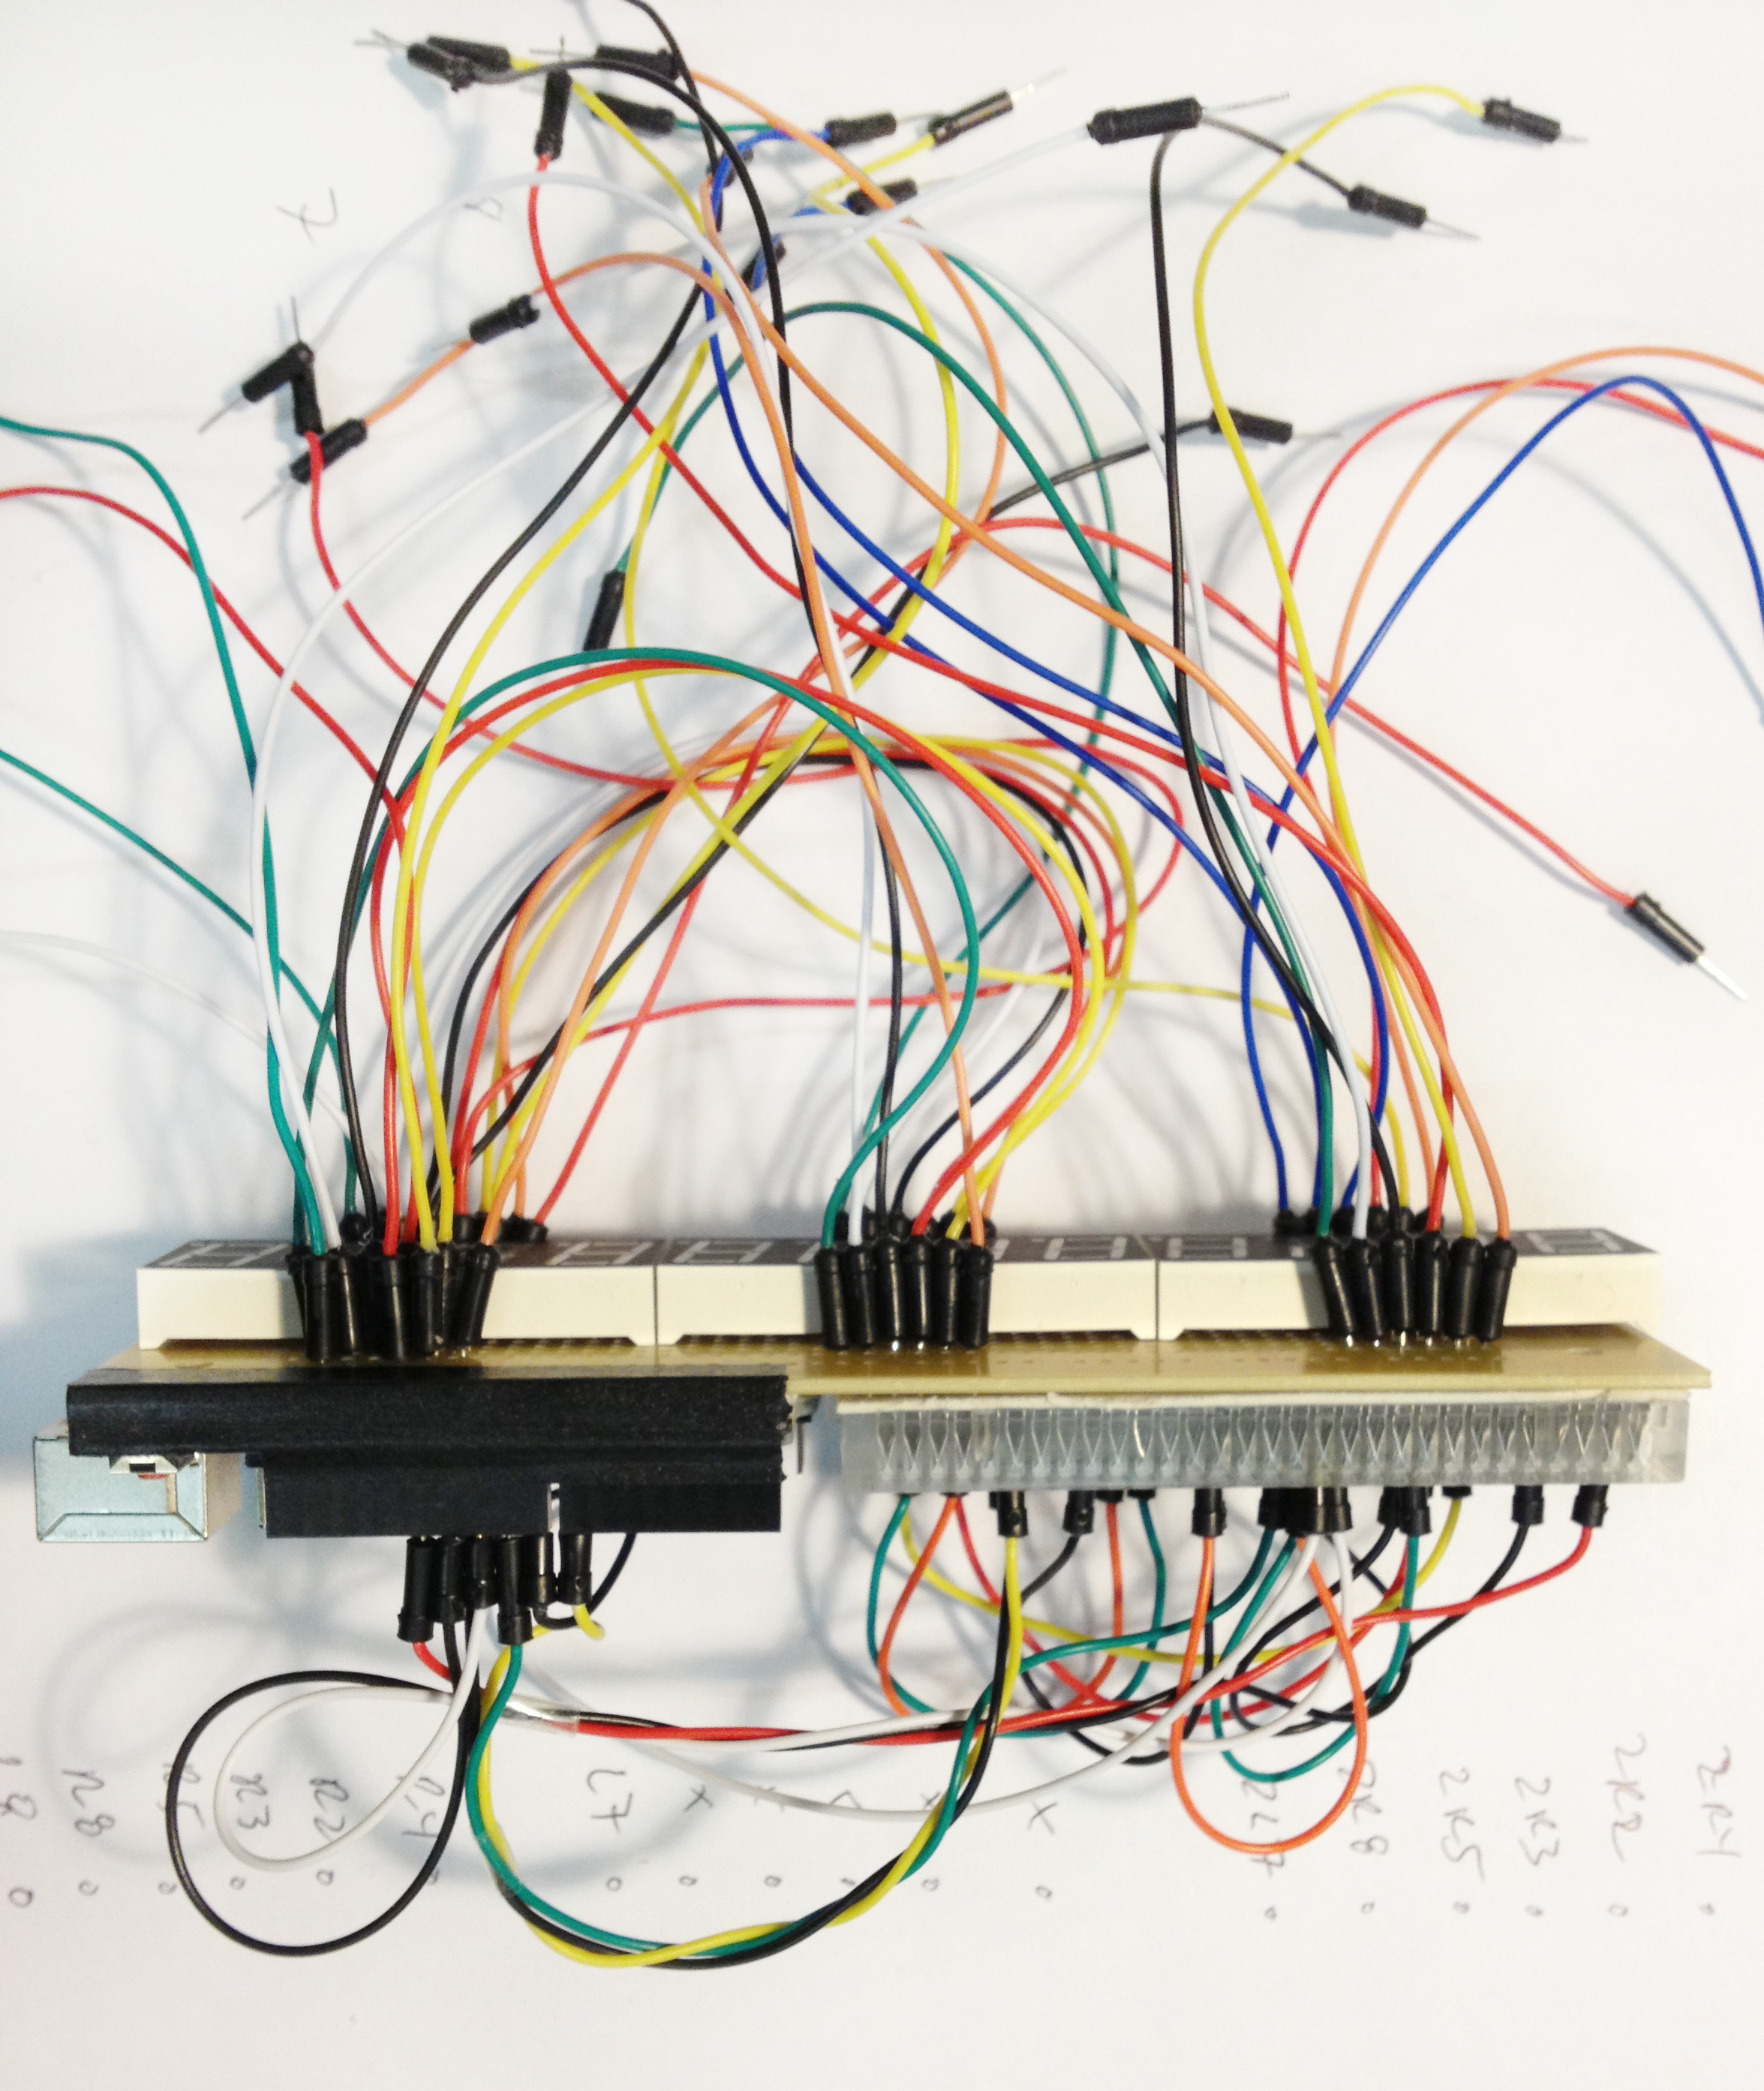
Currently, I’m working on the back end of the system to get energy information in real time from individual plug loads. I received a plug monitor that runs the open-source protocol Zigbee that will interface with an Xbee adapter that I already have hooked up to an Arduino. The challenge now is to make the two devices communicate with each other, and then design a system that will turn this information into a visual and physical spectacle.
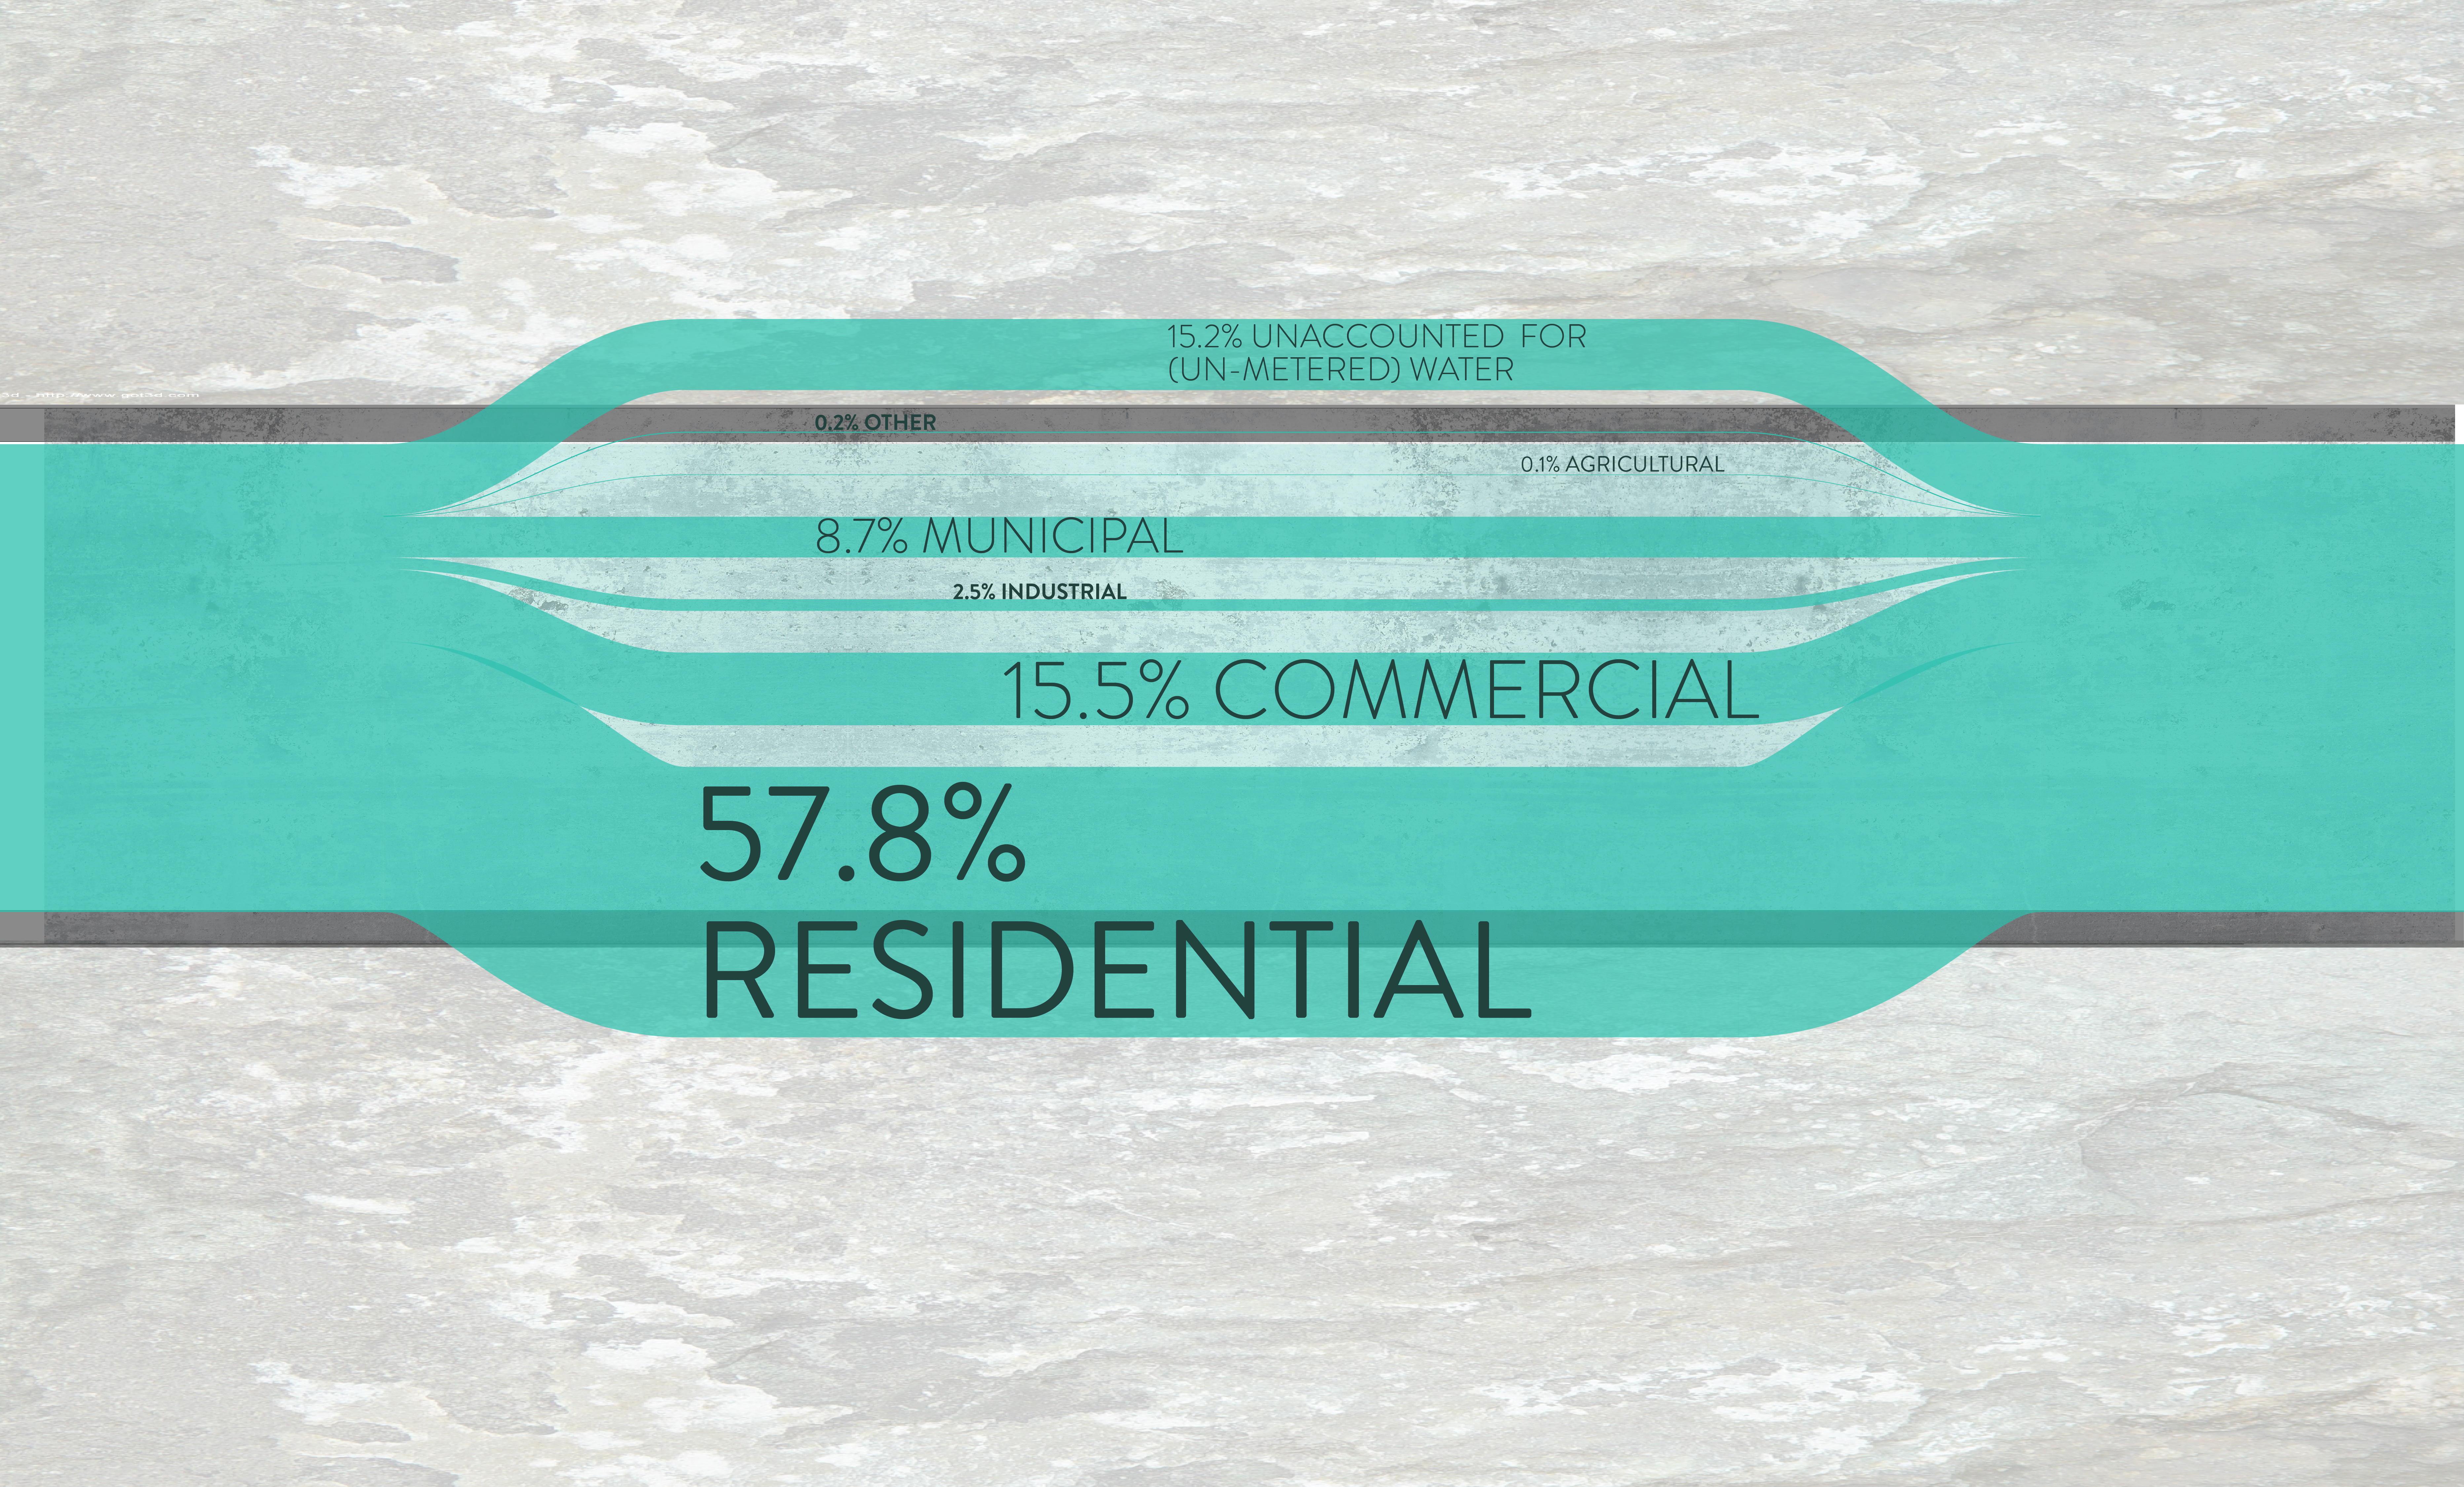
Bostonians, through their water usage, are one part of an extensive, connected system. The delivery of water to and from your home comprises of more resources than water alone and results in large scale infrastructural interventions that shape our landscape and impacts ecosystems on both sides of the chain. Through exploring methods of communicating these concepts, I hope provide a tool that educates users, encouraging them to reduce water usage and a have a better awareness of their environmental impacts.
THINK BIG:
WeShare is a public service platform committed to promote equity and access in the application for college and university led community programs. WeShare serve applicants and member programs by promoting holistic application and selection process.
START SMALL:
Membership is open to college and university led non-profit programs that strive for provide vital resources to local communities and grow public service leaders on multiple levels in the Boston and Cambridge communities.
On WeShare, applicants discover amazing community-based, nonprofit public service programs they would have never otherwise known. WeShare also believes strongly in providing free and equal access to non-profit programs for all applicants, regardless of socio-economic status.
For non-profit programs:
+ Many programs are small scale and cannot afford to have a website. WeShare can provide easy setup for them to have a storefront. Better publicize themselves with statements, images, videos and contact information.
For applicants:
+Applicants who want to explore can search for programs based on Interest, community, day, type, time period, etc.
ACT NOW:
I’m trying to connect to as many programs as I can. Also there are several key projects that I’m participating to establish better connection with them. Meanwhile, I’m revising the website interface to make it more appealing and functional for applicants and member programs.

« Previous 1 2 3 4 Next »