Networked Urbanism
design thinking initiatives for a better urban life
apps awareness bahrain bike climate culture Death design digital donations economy education energy extreme Extreme climate funerals georeference GSD Harvard interaction Krystelle mapping market middle east mobility Network networkedurbanism nurra nurraempathy placemaking Public public space resources Responsivedesign social social market Space time time management ucjc visitor void waste water Ziyi
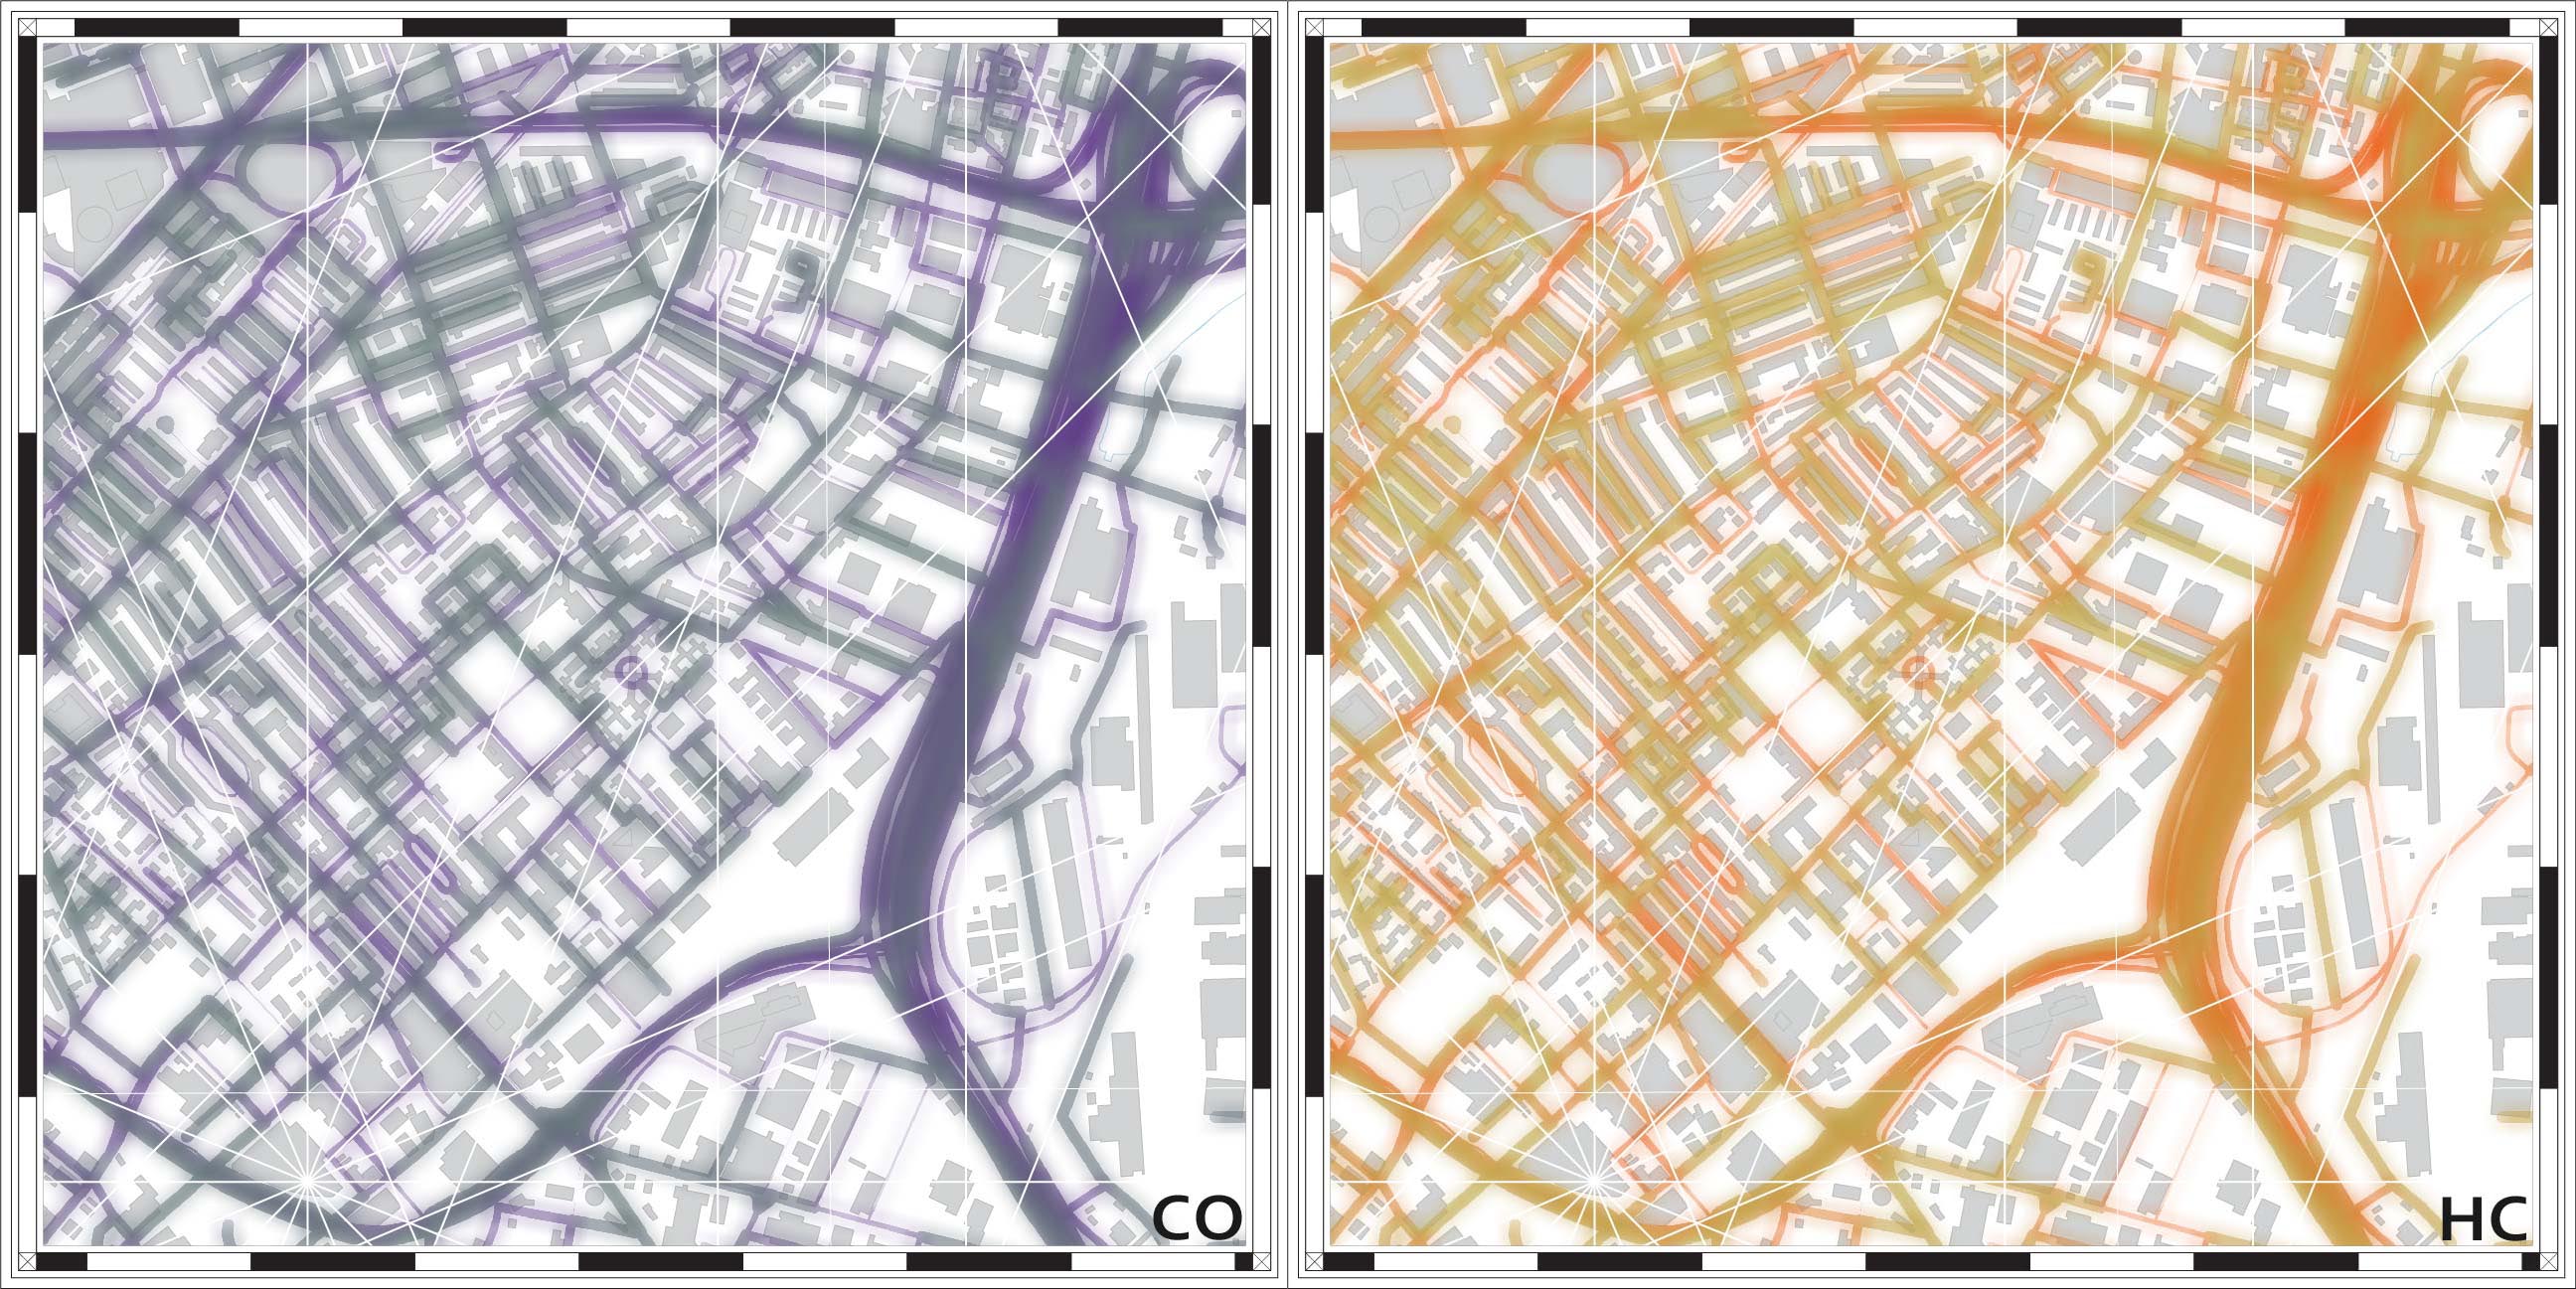
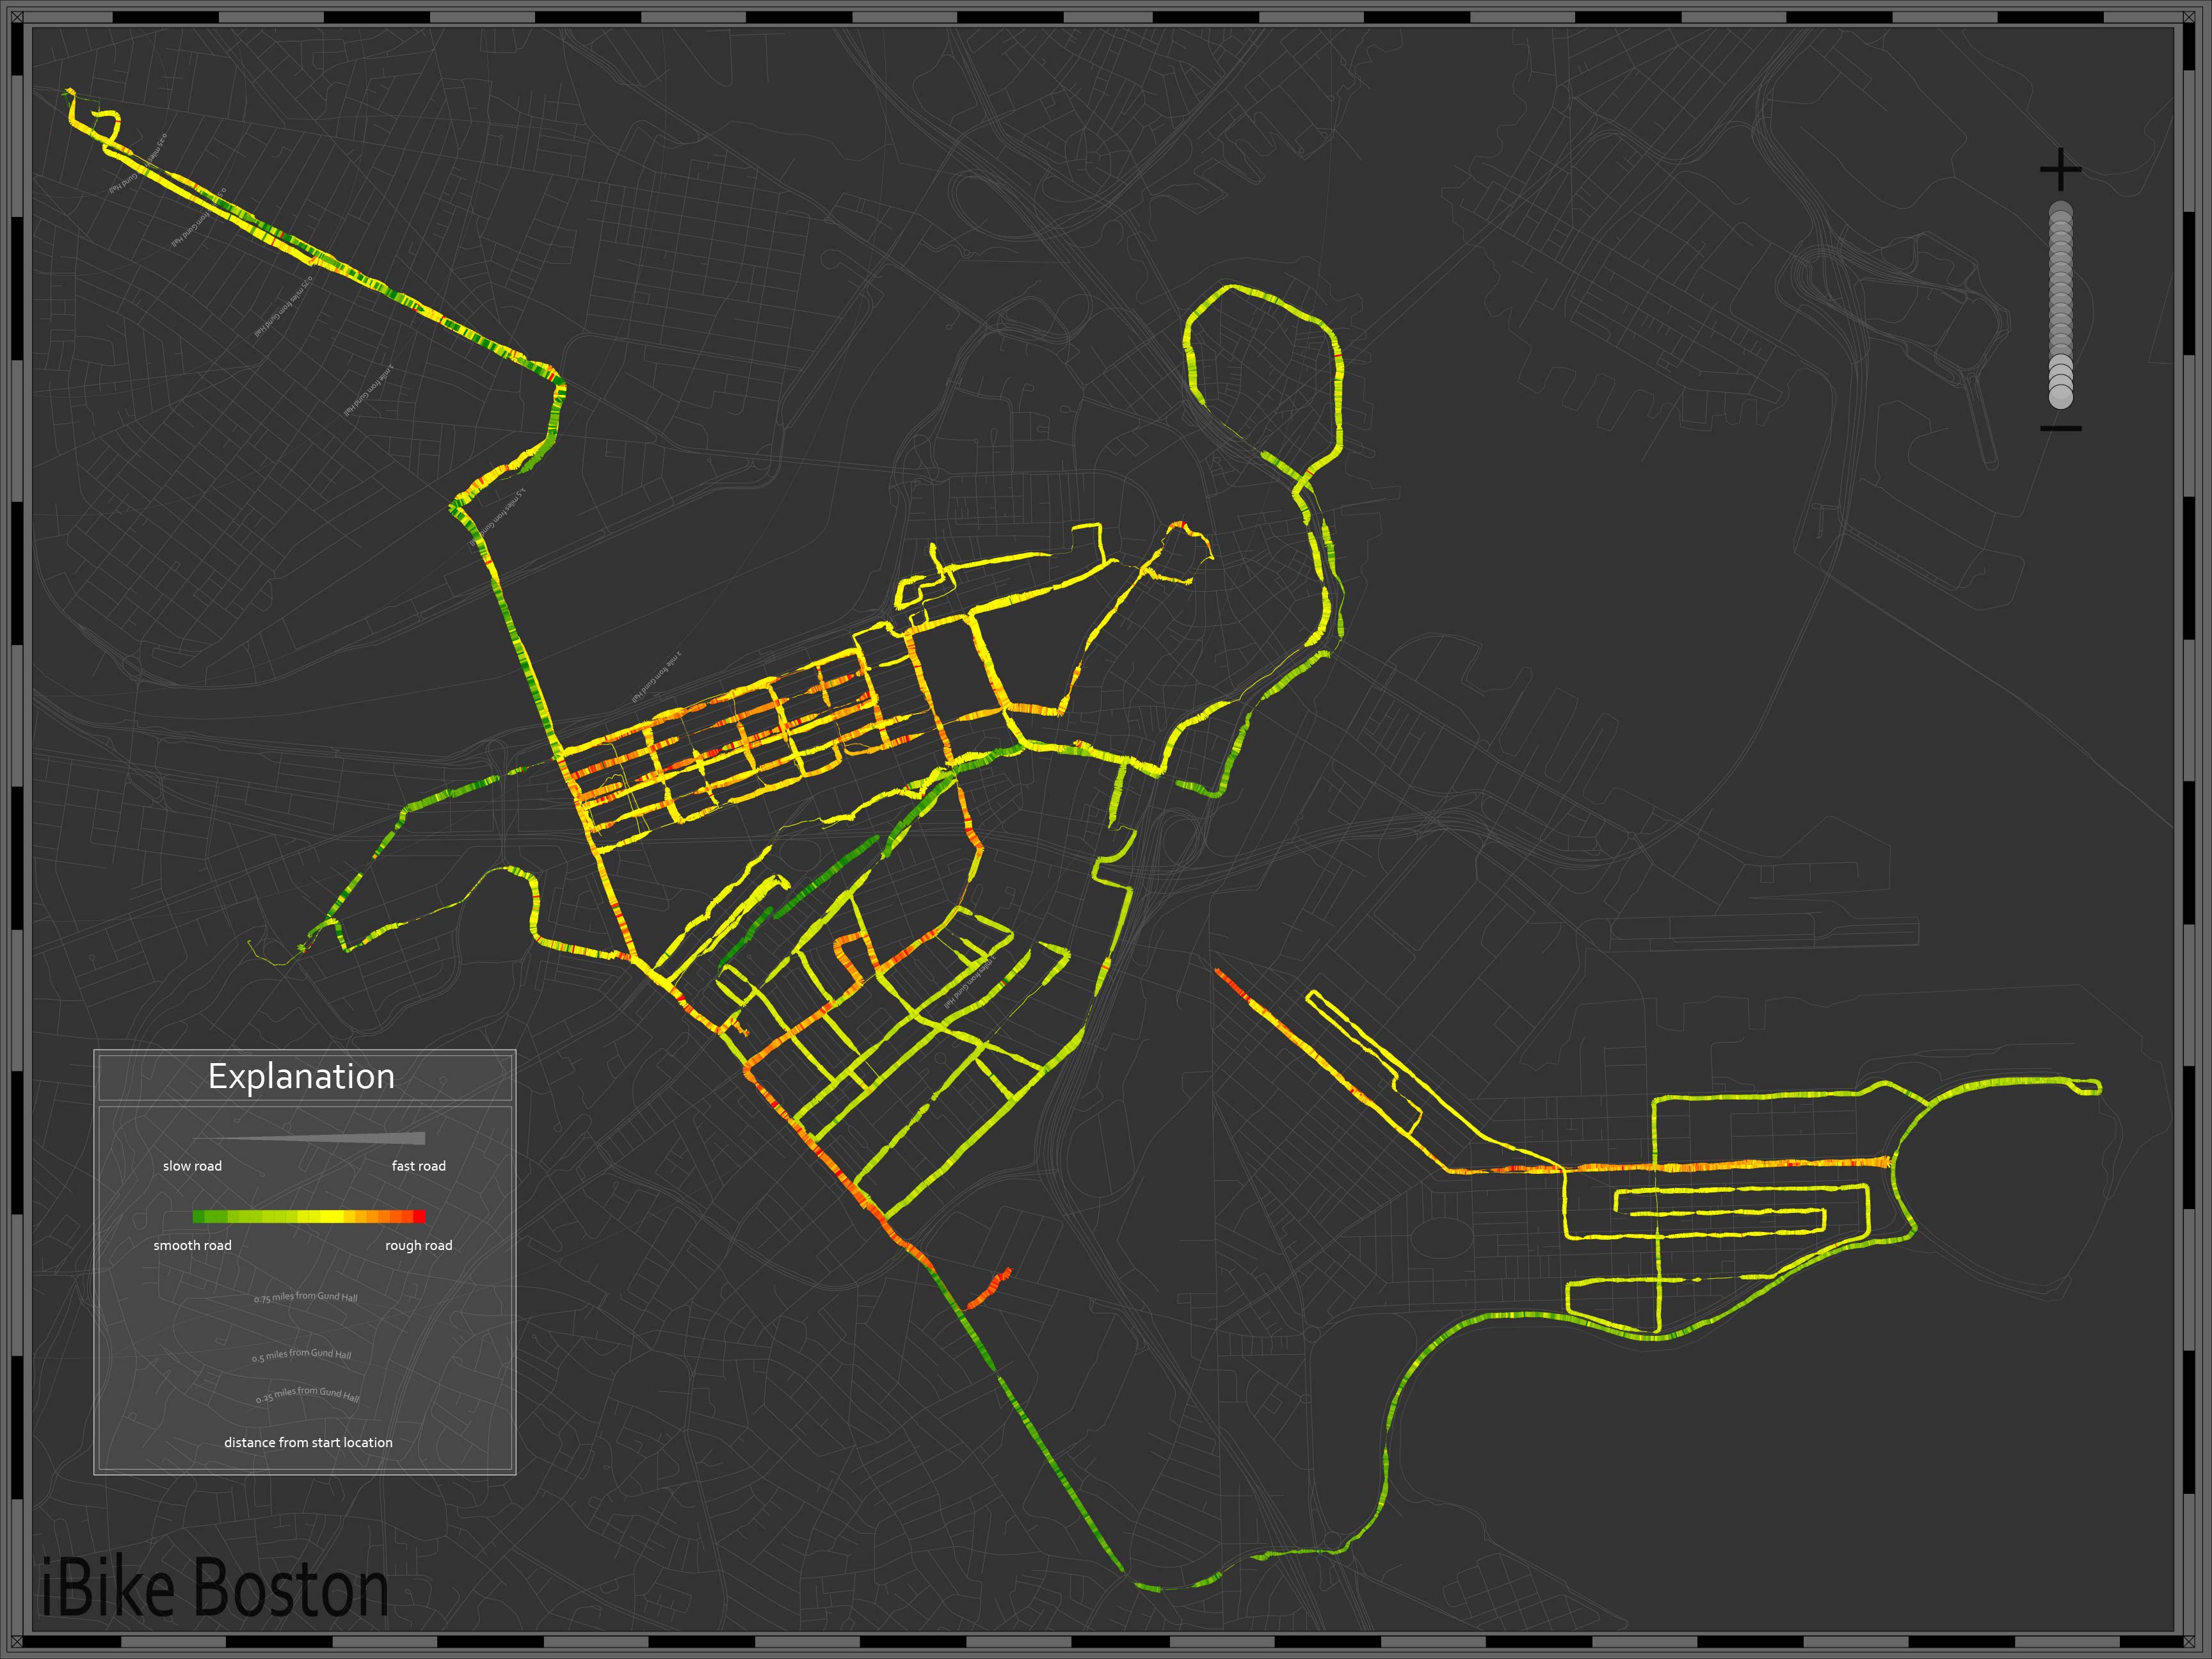
iBike, questions both the data collection as well as the dissemination. By mounting specific sensors to a bicycle data was collected in an effort to draw the experience of cycling in Boston. Using an accelerometer to measure micro-topography and a GPS to geo-locate the information and to provide speed data, I am questioning the existing maps by redrawing the city based on the experience of cycling. The width of roads is drawn based on the speed of travel (faster roads feel wider) and the micro-topography is drawn by increased density of marks when viewed at the neighborhood scale and as a color gradation at the larger scale. The resulting maps provide the cyclist with a layer of information absent in existing cycle maps that relates directly to the human experience.
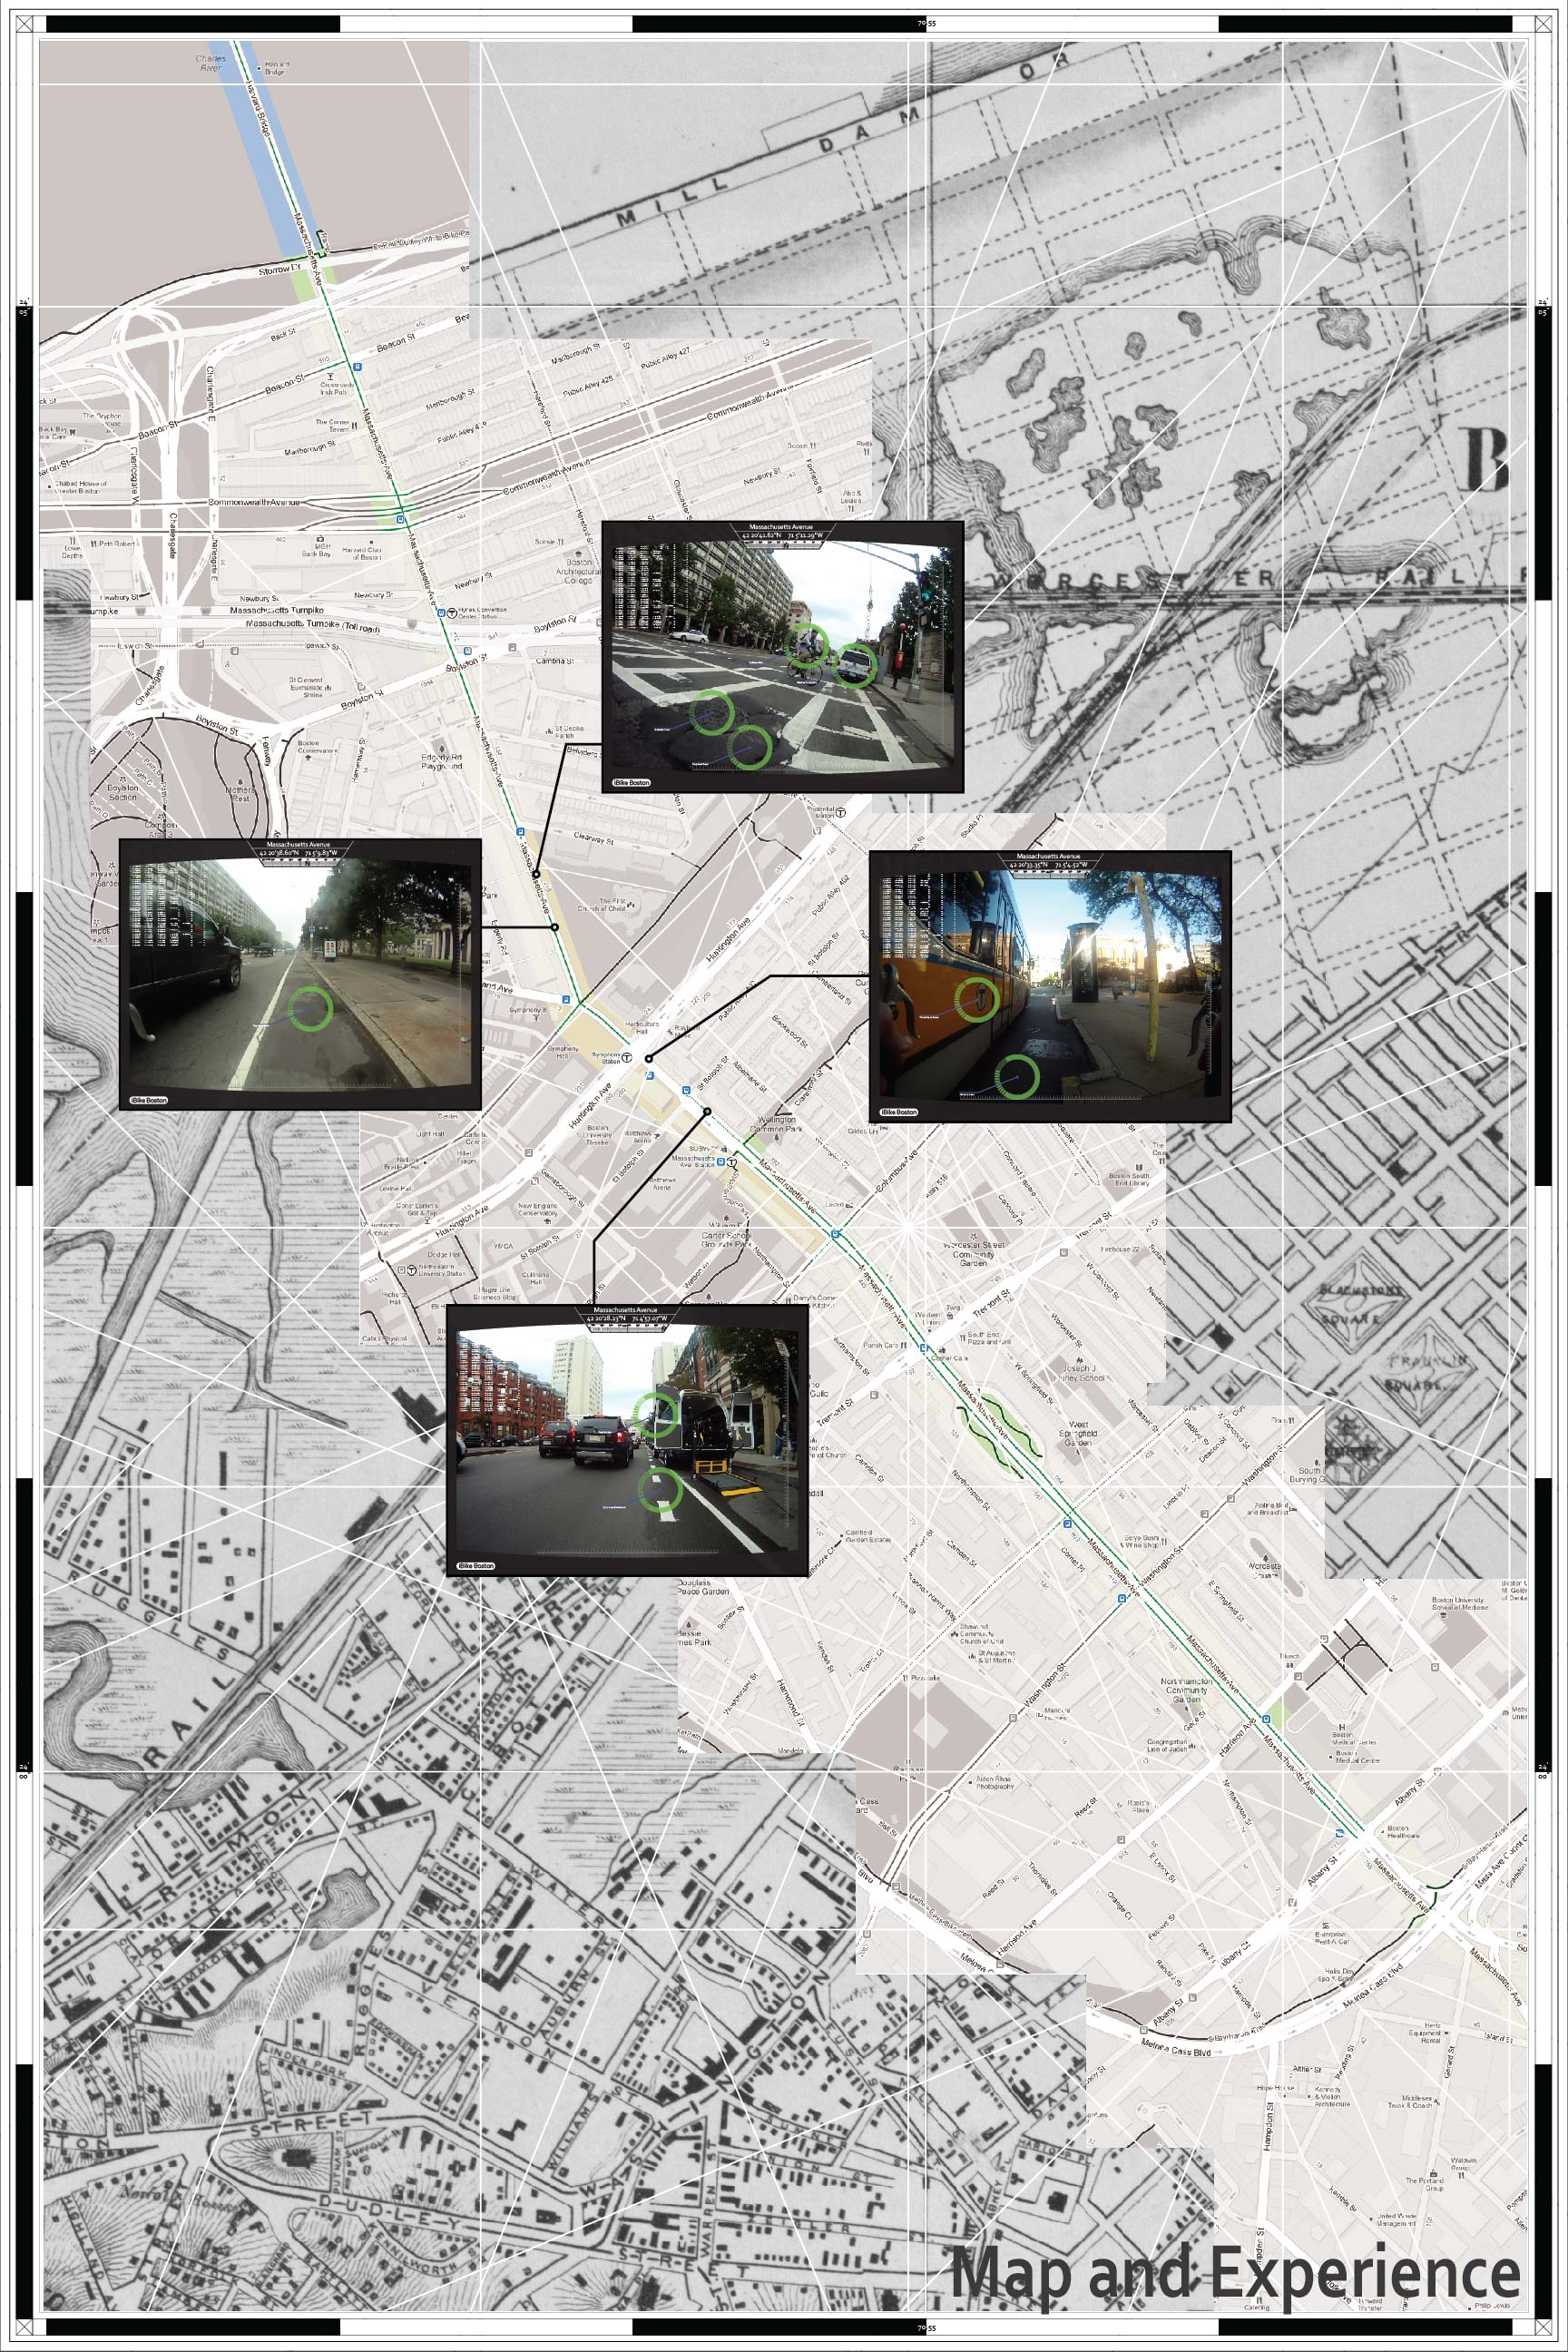
iBike Boston began with a simple proposition, go out and explore Boston, discover the city. This seemed a funny proposition as Boston is my home, where I have lived and worked for eight years, having grown up in a smaller city fifteen minute to the south. Accepting the challenge of discovering my city I decided to take my bike and ride around the residential part of South Boston. I have spent quite a bit of time in Southie, but always along the water or along Broadway, the main street running through the middle. What I found was that it was nearly impossible to get from my appartment in the South End to South Boston, a distance of only about two miles. Though Boston has been making great moves to become a more cyclable city, there exist still major gaps in the infrastructure and linkages. The two mile ride to Southie bring you across a four lane intersection and on ramp over the highway and around a major rotary, the way back sends you under the highway where no cross lanes exist.
This adventure got me thinking about how different the rhetoric about Boston being a more cyclable city is from the actual experience of riding. I began looking at maps, both cycle specific as well as common digital maps. The cycle maps that if found provided little information on what the surficial conditions actually were. Cycle lanes, when represented at all, were color coded lines drawn over centerline of streets, simply denoting that a cycle lane exists with no hint at the quality or width of the lane, just a demarcation of it’s existence. The base maps that the diagrammatic overlays were applied to are similarly simplified, seemingly dependent on satellite imagery to provide any “real” surficial information.
The ubiquitous google map that everyone is familiar with stands as a contradiction to the access of huge amounts of data. The flattened surface of the “map” view juxtaposed with the satellite imagery layer are presented as a complete picture of the world, encompassing all of the resolution necessary. With this dichotomy of the ultra simplified map and satellite imagery a certain thickness of information that had been drawn into maps for centuries has been wiped away. Further, the ubiquity of data collection devices (smart phones with gps, etc.) bring to question why modern cartography has largely been simplified (perhaps because of the ubiquity of data collection and dissemination).
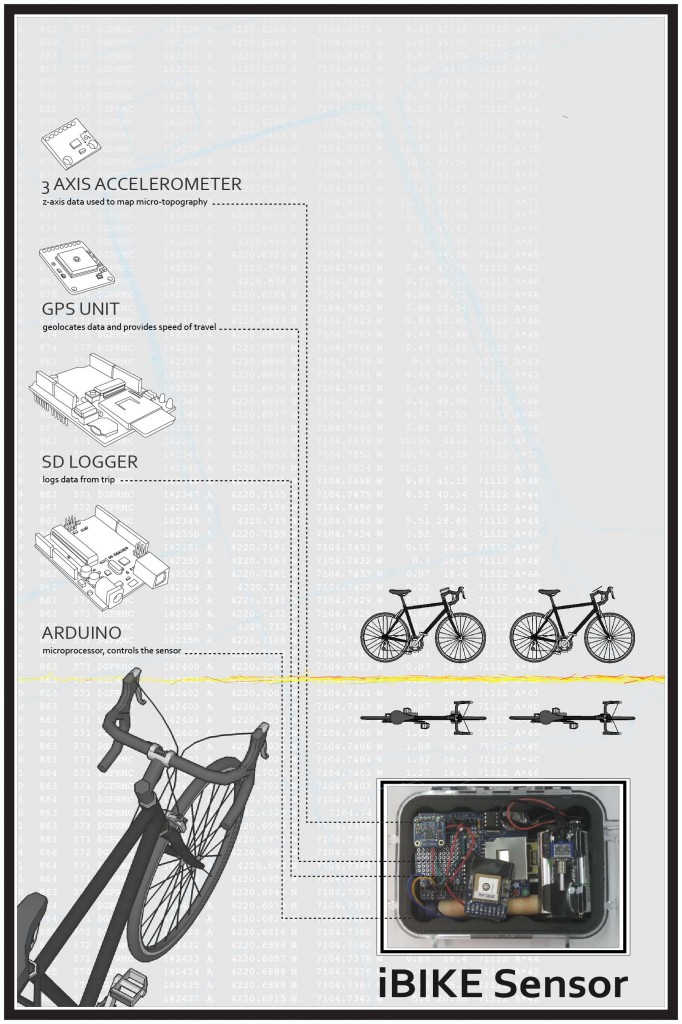
From this research I decided to explore how a thicker more informative cycle map could be drawn, to remap the city drawing the experientiality of cycling. To do this I built a sensor to mount to my bike in order to map data related to the experience of the ride. I focused in on two parameters to map, micro-topography and speed. I used an accelerometer to map the micro-topography; using the z-value from the inertia sensor I was able to map the feeling of the road while riding. A GPS was used to geo-locate the information and to provide speed data. The width of roads is drawn based on the speed of travel (faster roads feel wider) and the micro-topography is drawn by increased density of marks when viewed at the neighborhood scale and as a color gradation at the larger scale. The resulting maps provide the cyclist with a layer of information absent in existing cycle maps that relates directly to the human experience. The limited parameters of micro-topography and speed provide quite a bit of information pertinent cyclists, as the yare two major factors in the comfort of a ride. Additionally the use of the accelerometer and GPS allows for future scalability as most, if not all, smart phones have these two sensors built in. With the intention of turning this into an app crowd-sourcing data iBike can redraw the city based on the experience of cycling temporally, showing conditions as they change. The maps have the ability to transition as road change, construction begins and ends, even diurnal maps can be created so that the cyclist can better understand what the riding conditions are likely to be when they set out.
![0.18_Park_1 [Converted]](http://networkedurbanism.com/wp-content/uploads/2012/12/Park-and-Back-Bay.jpg)
Developing into the future I am looking to formalize iBike Boston into a crowd-sourced digital mapping system, drawing thick user based maps that redraw the city based on experience. Additionally I am developing sensor packs to measure other inputs that affect the quality of cycling. By collecting and mapping this data I am looking to impact the way we urbanize our city and environs, the city exists as a system of people, not of cars and our infrastructure should reflect that.