Networked Urbanism
design thinking initiatives for a better urban life
apps awareness bahrain bike climate culture Death design digital donations economy education energy extreme Extreme climate funerals georeference GSD Harvard interaction Krystelle mapping market middle east mobility Network networkedurbanism nurra nurraempathy placemaking Public public space resources Responsivedesign social social market Space time time management ucjc visitor void waste water Ziyi
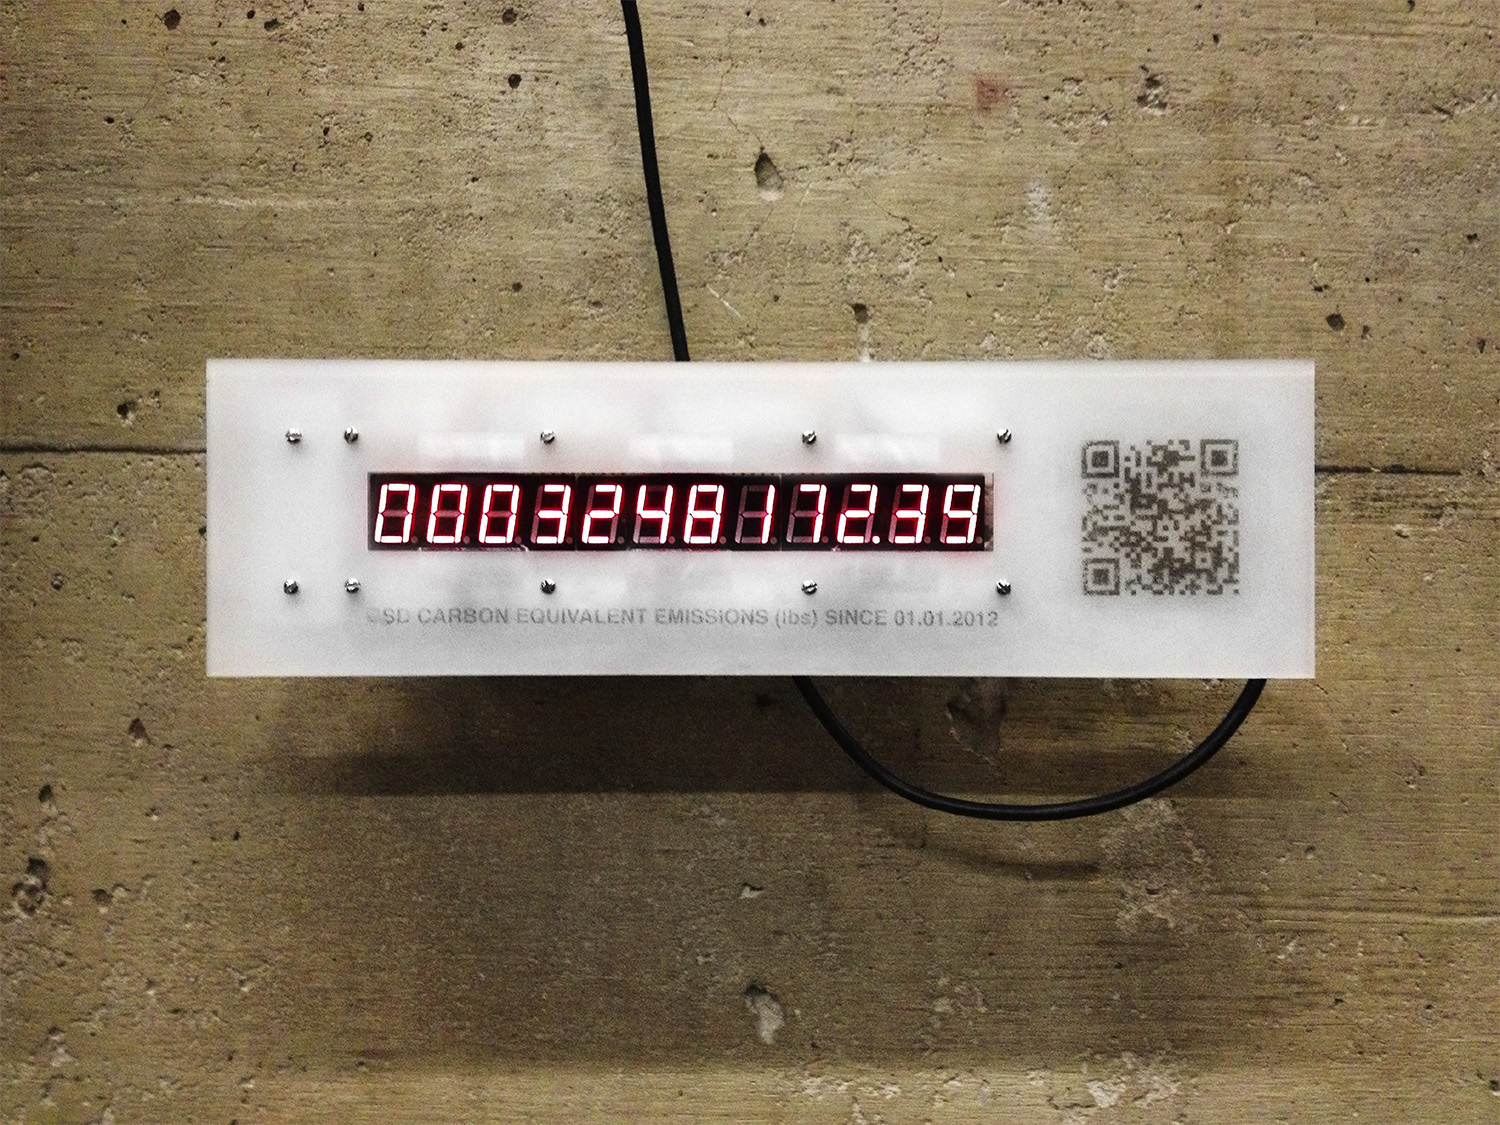
The biggest challenge to reducing our collective energy footprint is visualizing what is normally unseen and forgotten, namely the energy we use everyday. Of course, even if our energy use is rendered as a number, or a graphic, it’s a bit too abstract to actually change our behavior. My initial experiments with this idea led to the development of the carbon counter that is currently displaying the carbon output of the GSD in the Chauhaus. The idea was that people would come up to this object of intrigue, snap a picture of the QR code, and be led to the Architecture 2030 Challenge website (which challenges architects and urban designers to realize net zero projects by t he year 2030). Not surprisingly, this device is pretty hard to miss, so I’m currently trying to think of an installation that will attract more attention to the actual flows of energy at the GSD. The installation is going to be coupled with a brief animation that describes all the ways that the GSD is using energy, and how to improve our collective performance.
Currently, I’m working on the back end of the system to get energy information in real time from individual plug loads. I received a plug monitor that runs the open-source protocol Zigbee that will interface with an Xbee adapter that I already have hooked up to an Arduino. The challenge now is to make the two devices communicate with each other, and then design a system that will turn this information into a visual and physical spectacle.