Networked Urbanism
design thinking initiatives for a better urban life
apps awareness bahrain bike climate culture Death design digital donations economy education energy extreme Extreme climate funerals georeference GSD Harvard interaction Krystelle mapping market middle east mobility Network networkedurbanism nurra nurraempathy placemaking Public public space resources Responsivedesign social social market Space time time management ucjc visitor void waste water Ziyi
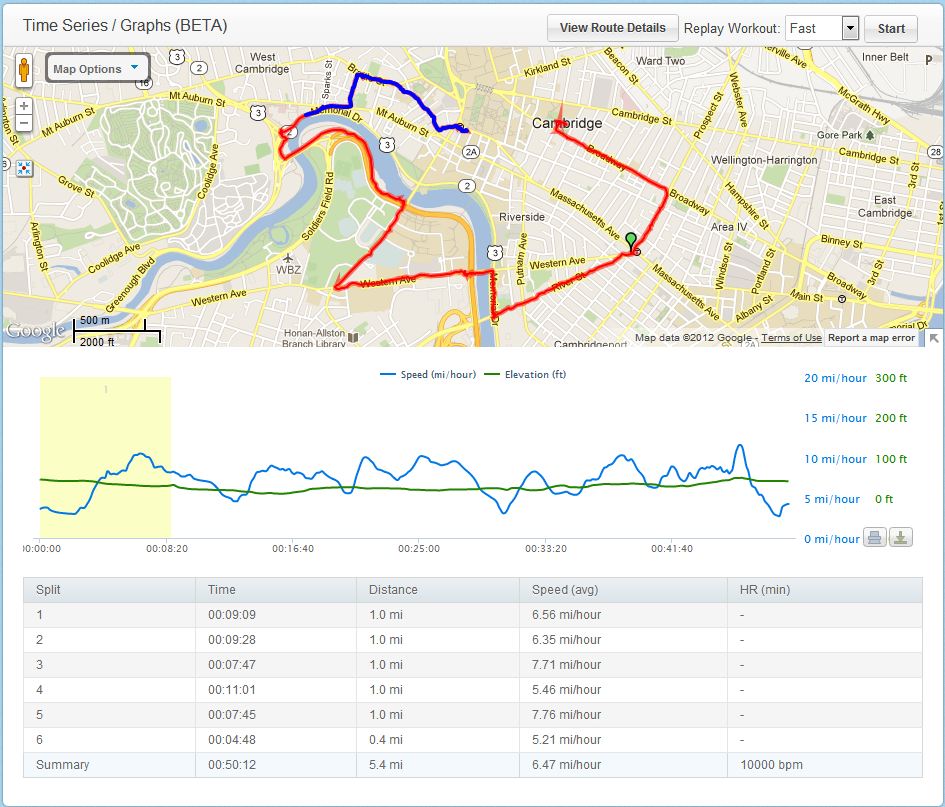
The following data was logged during the studio bike ride on Tuesday with the iphone app, MapMyRun. The data is more interesting than I originally thought since the pace was measured in realtime, and not as an average at the end. You can see the variable pace graphed along with the elevational data, which gives us a better understanding of the route. Rather than the trip takes us 50 min to complete, we know where we were the slowest, and can better identify the conditions that effect bike traffic (ie: road conditions, car traffic, multiple crosswalks etc.)